|
DYI Residential Energy Production - December 2013 DYI Home Solar Electricity Production  Do It Yourself Energy Production Kits produced by https://www.anapode.com For Do it Yourselfers who want a turn-key kit to install, I recommend https://www.anapode.com. They have the best philosophy and prices I've found for a turn-key, Do-It-Yourself Solar Panel kit. Make sure to request "made in USA" panels, as saving USA jobs will only raise the system cost by less than 5%! Typical, DIY installations will cost ˝ of a system installed by a Solar "Pro". You can purchase systems with good economic return on investment today. All prices include all the parts you need, shipping is included. Best value for roof mounted kit we've found. |
|
Residential Energy Production - Solar Pod - December 2013 DYI Home Solar Electricity Production 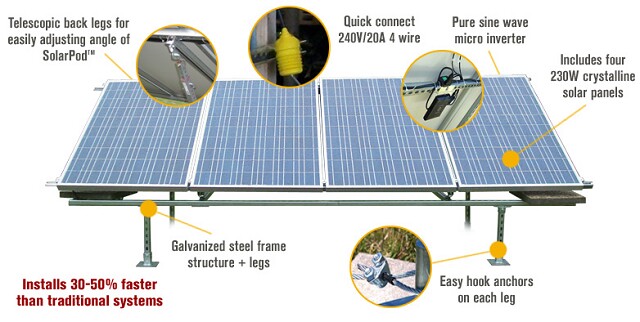 Here is the best pricing I could find an a DYI ground mounted kit www.mysolarpod.com Return on investment for this system with and without any tax rebates is calculated as follows: Purchase Price: $3,200 Shipping Cost: $800 Estimated Installation Cost: $200 Total System Cost Installed: $4,200 Assume, 1,000 kW-Hour Production (Michigan Sunlight) per year and $.15/kW-Hr Electricity Cost. $ of Electricity Produced Annually = $150 (1,000 kW-hrs x $.15/kW-Hr) Years to Payback: 28 Years ($4,200 System Cost / $150 / Year production) Assume 30% Tax Rebate Credit: $2940/ $150= 19.6 year payback |
|
Kraig's Solar Array - Ordered December 27, 2013 Best Pricing On-Line - Great Website and Service  Best pricing on solar components https://www.civicsolar.com I purchased the following components: Four (4) SolarWorld SW 260 Mono 260 Watt Solar Panels Made in USA with four (4) Enphase Energy M250-60-2LL-S22 Microinverters I'll be doing my initial monitoring with my Efergy monitoring Unit and building my own racking system so that I can experiment with various options for potential business opportunites for Schultz Engineering, LLC. My goal was to have the system installed for less than $2.50/watt by doing it myself. (March 16, 2014 Note: It actually came in at $3.00/watt.) |
|
Return on Investment for Solar Panels - December 29, 2013 How to calculate Return on Investment for a solar system? Please note: Each state gets a different amount of sunlight so you can compensate according to this map (http://eloop4.goldlasso.com/UserFiles/c_565/Image/pvmap_usandgermany.jpg). My friends in West Michigan are getting around 1,200 KiloWatts Hours per year from each 1,000 Watts of Solar Array capacity they have installed. I purchased a 1,040 Watt array, so I am expecting to get around 1,200 kW Hrs per year from these panels. Residential ROI: At $.15/kW-hour, 1,200 kW Hrs is $180 per year "savings" on my electric bill. If my total system cost is $2,500 installed / $180 annual savings, then my residential payback is around 14 years. Transportation ROI: For my transportation, if I don't want the electricity I put into my electric vehicle to come from "dirty" sources, it is my obligation to get my electricity from "clean" sources. So, if I use my 1,200 kW hrs of Solar Electricity to power my electric motorcycle, I can travel 12,000 miles/year (my bike uses 100 Wh/mile from the wall). If I traveled those same 12,000 miles in my mini-van, it would cost about 12,000 / 22mpg x $3.50 = $1,909. Suddenly, it's possible to have a payback of less than 2 years when the electricity is used for transportation! |
Panels Received - January 9, 2014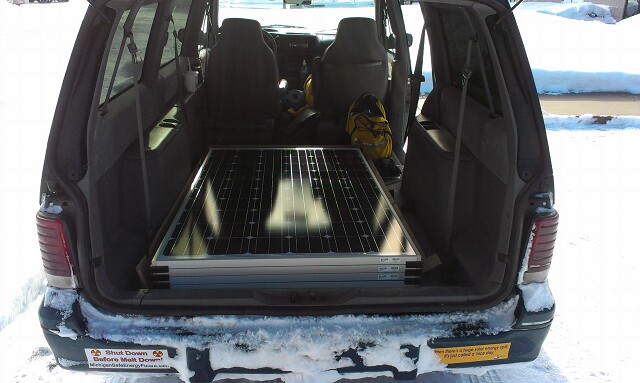 Building Array in Living Room (it's too cold outside!) - January 11, 2014 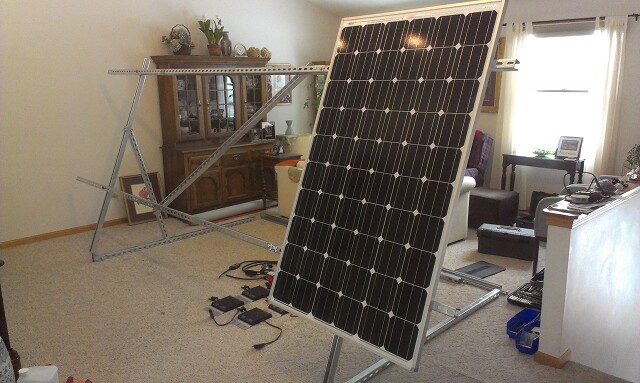 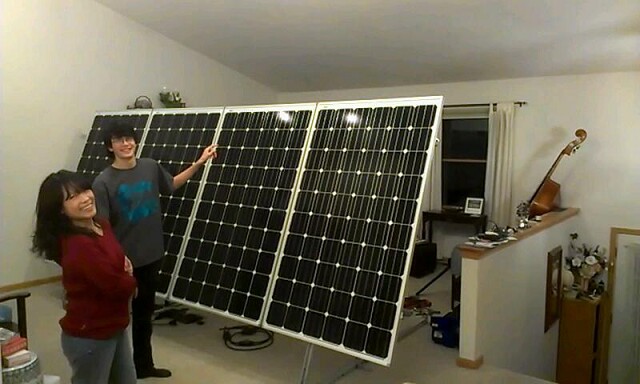 February 8, 2014 Panels are hooked up outside! 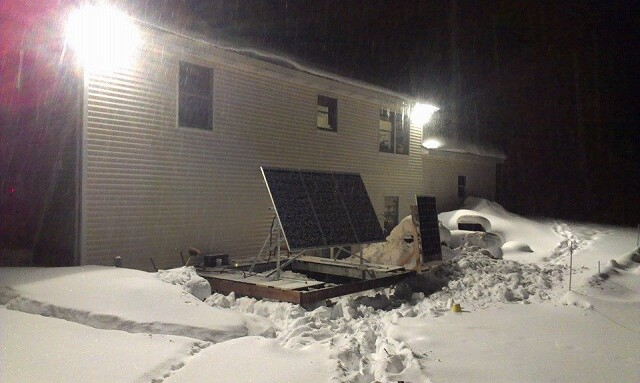 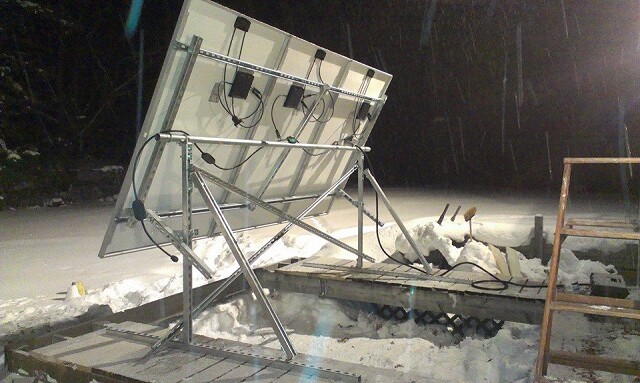 February 21, 2014 Approved for Parallel Production! 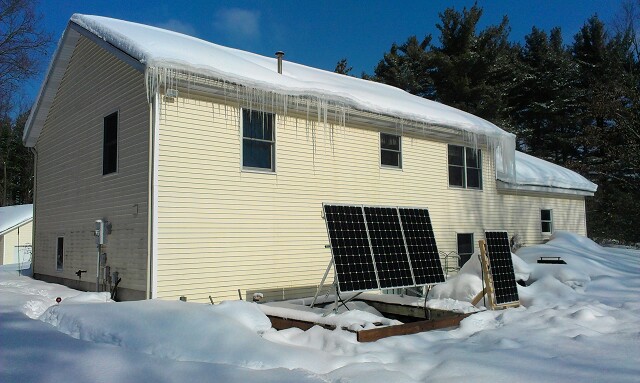  The electrical wiring and disconnects inside and outside the house turned into much more work than I originally anticipated. I was able to use the existing circuits and wiring from the Hot Tub that used to be where I installed the solar panels, but there was still a lot of hook up time and cost for components. Round Numbers: Solar Panels and Inverters cost $2,000 The Racking Materials cost $750 Electrical Wiring, Switches Disconnects cost $250 Complete Installed price for all components and permits = $2,937 |
|
Solar Production - Feb. 22 and 24, 2014 Here is a Sunny Day's Production 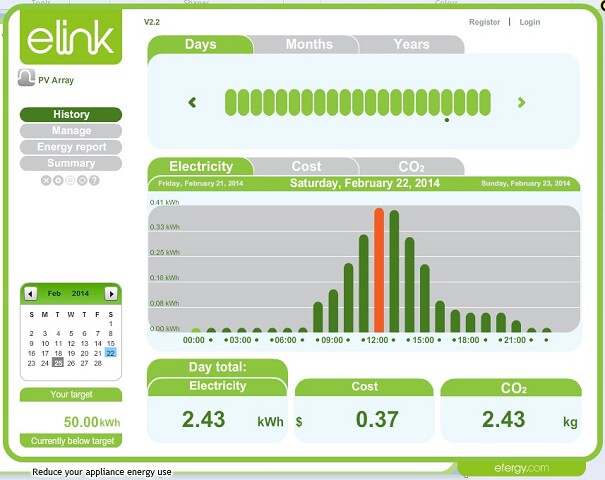 Here is a Overcast Day's Production 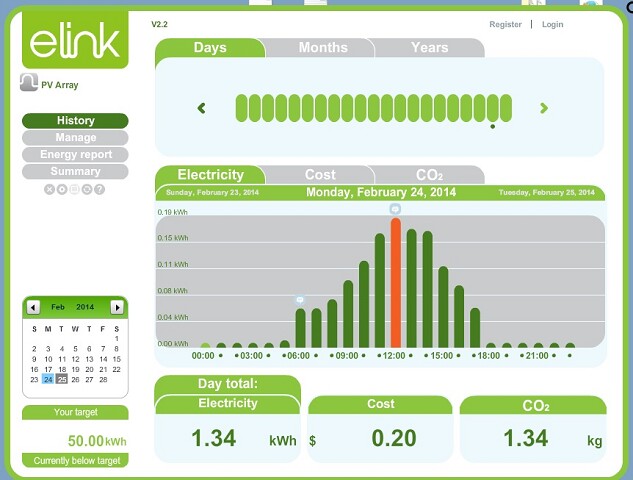 Important things to note, there is a cycle of production, that has to do with the "power" of sunlight, but is also directly related to the fact that the panels are not tracking the sun across the sky. |
|
Enphase MicroInverter Phantom Load? - Feb. 27, 2014 I have four (4) Enphase M250's installed on my array that demonstrate a "phantom" load of 51 Watts when the sun goes down (12.75 Watts/Inverter). For a 14-hour night that accumulates to 714 Wh - Very significant for my 1,000 W array. I have an Efergy meter installed on my entire house to measure consumption. I have an Efergy meter installed on my solar panel lines to measure my solar production. I've verified that my Efergy meters directly correlate with my Utility's smart meter readings and with each other. Here's an Enphase blog on other people noticing the same issue: https://community.enphaseenergy.com/enphase_energy_community/topics/enphase_system_consuming_unusual_amount_of_energy_at_night? The response of the Enphase Engineer was this: "This is a common concern. Rest assured, the 200W reading is not real (pun intended). The reading you are getting is a result of the fact that your meter can't distinguish between "Real" and "Reactive" currents. Real currents are in-phase with the grid voltage and reactive currents are 90 degrees out-of-phase with the grid voltage. Utilities typically do not charge residential customers for reactive currents. The technical stuff. Here is where your 200W reading came from. Basically, the AC filter inside each M215 looks like a 660nF capaitor So, the reactive VA created by a system of 14 M215's is: Z = 1/(2*pi*60Hz*660nF) = 4019 Ohms Z (system) = Z/14units = 287 Ohms I rms(reactive) = 240 Vrms / 287 Phms = 0.836Arms VA = 240 Vrms * 0.836Arms = 200.7 VA "Real" or not the numbers are troubling. Any reactive loading in a system would generate wasted heat, whether it's billable or not is not the point of my system. I'm trying to save energy and create clean energy. My solution was to install an Intermatic T104R 24 hour timer/switch that isolates my Solar system from the grid when the sun isn't scheduled to shine. This method has been working great, the sun has been quite reliable in coming to work on time each day. 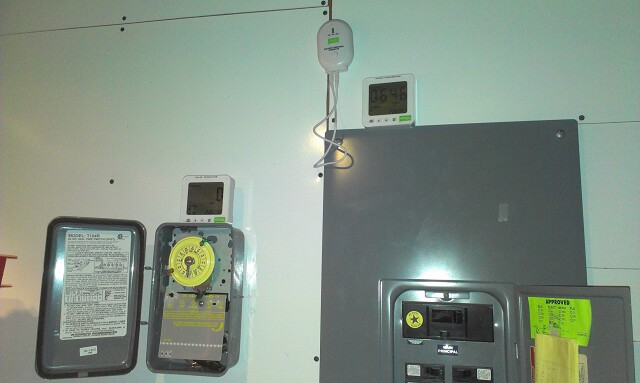 |
|
Interconnection and Net Metering Installation Complete - March 13, 2014 The process of getting set-up to become grid-tied with net metering with my Electrical Utility (Consumers Energy) was as follows:
 |
|
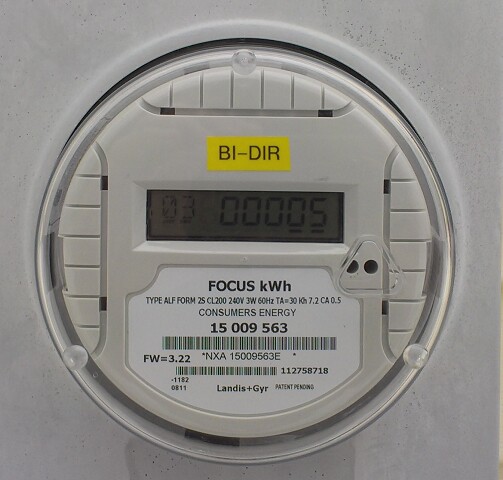
To Net Meter or Not - March 16, 2014 We put our solar system into operation on Feb. 22nd knowing that any overproduction of the Solar Panels would result in the power flowing into the grid and that we would be charged for that power and our electrical bill would actually go UP! That's right, our "dumb" non-directional utility meter could not tell which way the power was flowing, so when we overproduced, we would be charged to give our power away! This caused us to do exactly the right thing. We paid close attention to our consumption and production performance and we changed our consumption behavior. We attempted to balance our consumption with our production by doing things like laundry or cooking when the sun was shining. When I say "we", I mean even my wife became very interested in watching the meters when she understood we were being charged $ to give our power away. My sons have become more interested in our power production when I've threatened to put a meter on the video game systems and charge $1/kWh for electricity (this also inspired some good conversations about Economic and Governance Models i.e. monopolies and benevolent dictatorships). It's interesting to see how "taxation" properly applied can drive good behavior. 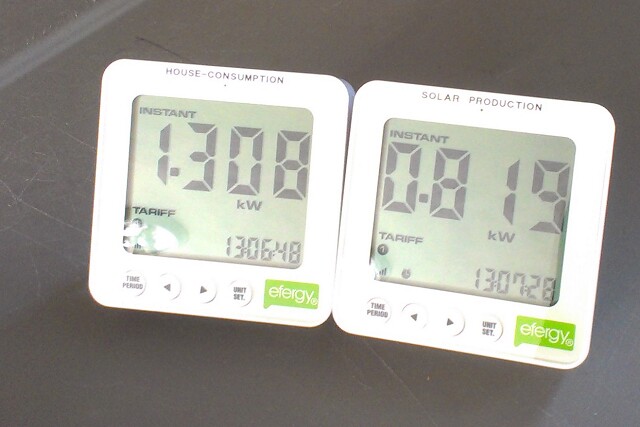 |
|
The Joy of Solar Energy - March 16, 2014 Each day when returning home from work, the first thing I do is give my wife a hug and say "Hi" to the kids. The second thing I do is check on how the house consumption and solar production has done. I can tell you I am much more in tune with my energy use, as is my family, and we are trending downward in our consumption. I am very happy we installed the system. It makes me feel good each day, and I am very happy to be more in sych with the Energy of the Sun. March 2014 Using 50% Less Energy from the Grid! We've continued our energy slide. In March 2014 (see Aprils Bill on chart below) we used 50% less power from the grid than 1 year ago. 30% less coming from energy efficiency improvements. 20% from the solar panels (they produced 80 kWH in March). In March, we also switched to 100% renewable energy from the Grid by paying $.01/kWh more. Going green has never been easier! 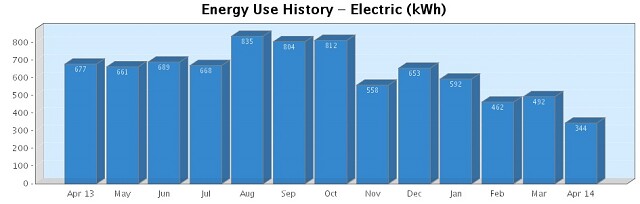 Here's the chart showing through the end of May 2014. Another month with over 45% less usage over previous years usage. 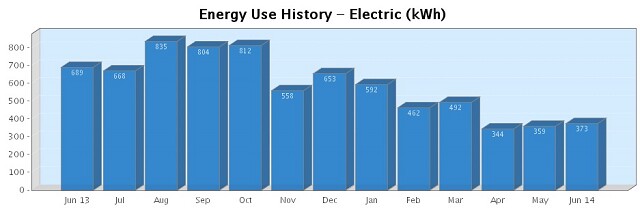 We cut our consumption from the Grid: 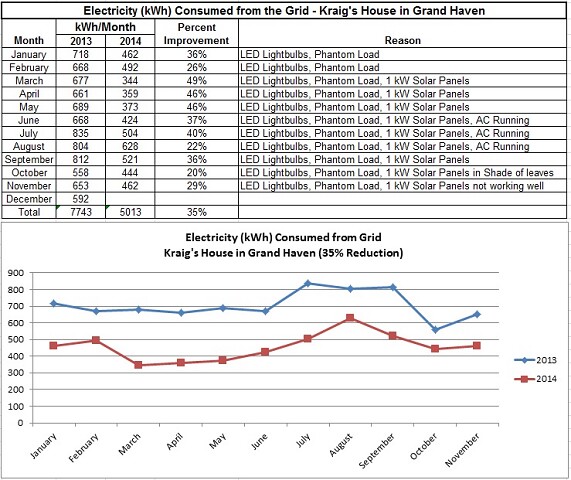 |
|
What is the Real Cost to Install Solar Panels at Your House? - June 8, 2014 Here is a spreadsheet to calculate what it will cost to install solar panels at your west Michigan home: Printable PDF File Editable Excel Spreadsheet File |
|
Some Data over Time - October 18, 2015 Here is almost two years data (January 2014 - October 18, 2015) for house consumption and solar production as measured by the Efergy Meters House Consumption: 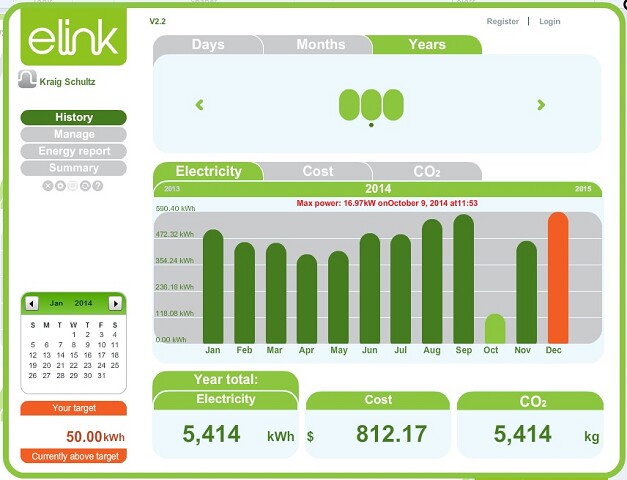 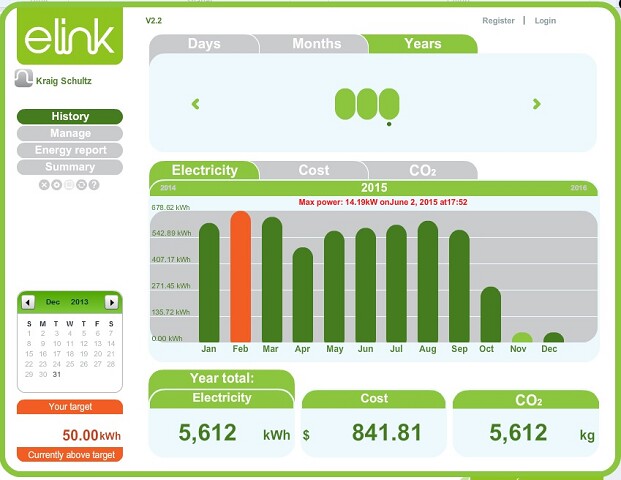 Solar Production: 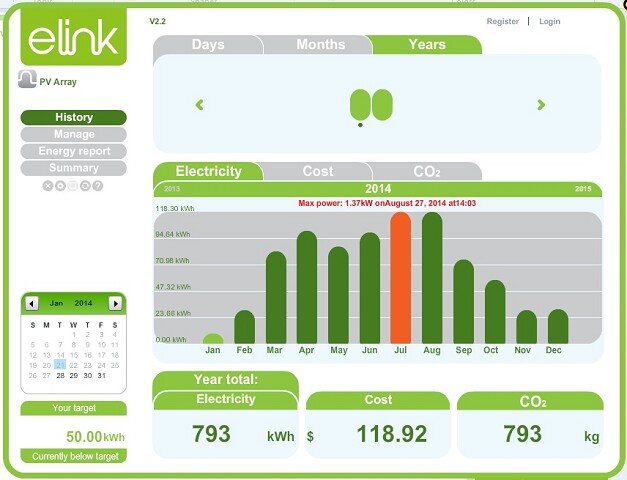 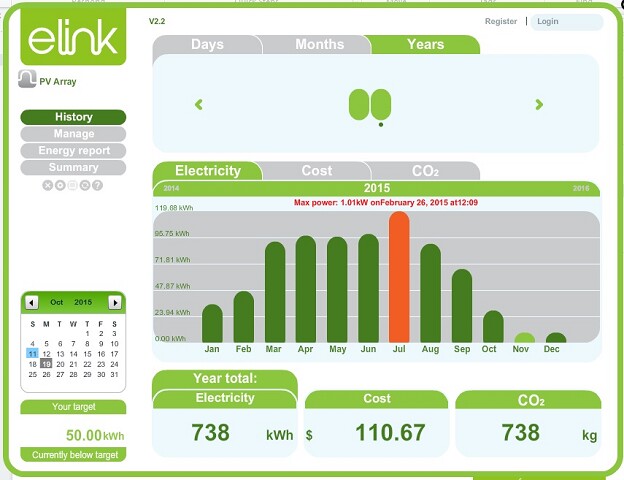 |
|
Spring 2017 Update In December 2016, after three years of trouble free operation, we made some serious upgrades to our solar PV system. We moved the original panels and rack to the front yard in front of the barn, and added one panel on the face of the barn. Then, we installed a new rack of twelve panels (Evergreensolar ES-E-220-fc3) on a Solar Tilt Rack with Siemens Enphase M215-IG Micro Inverters. Old System Peak = 1,000 Watt, New System Peak = 3,830 Watts. House Array Original four panels: 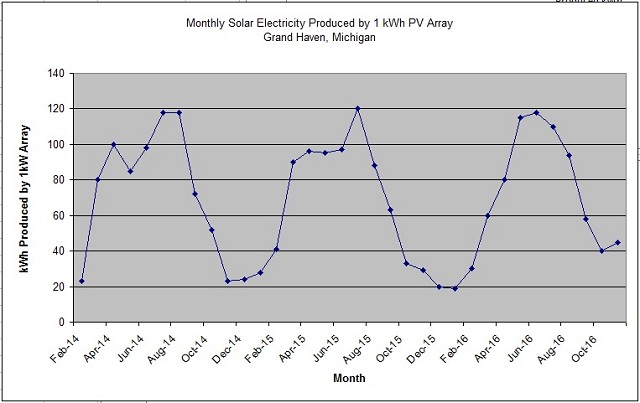 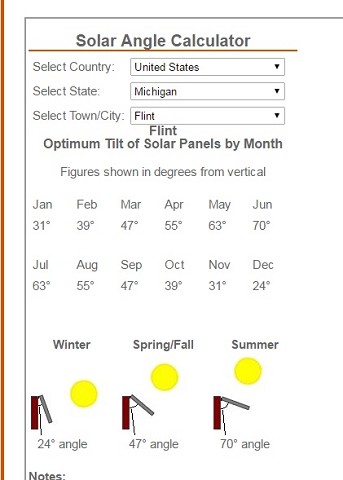 House Array 12 New panels: 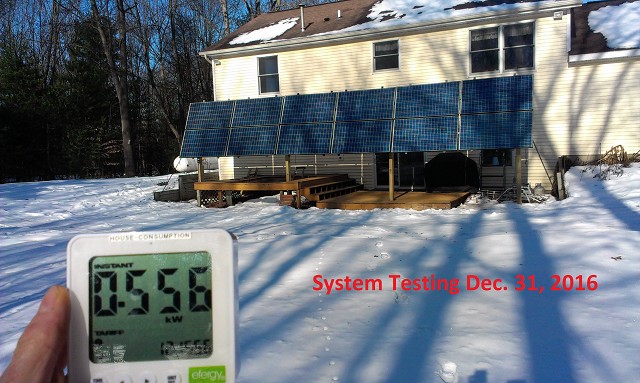 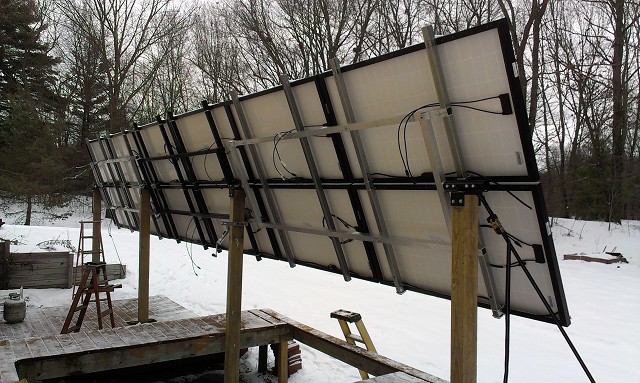 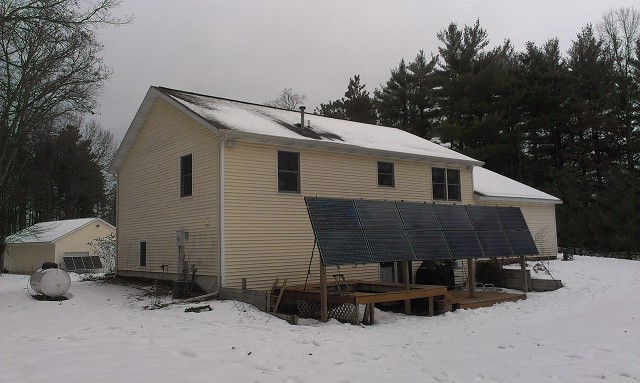 Barn Array: 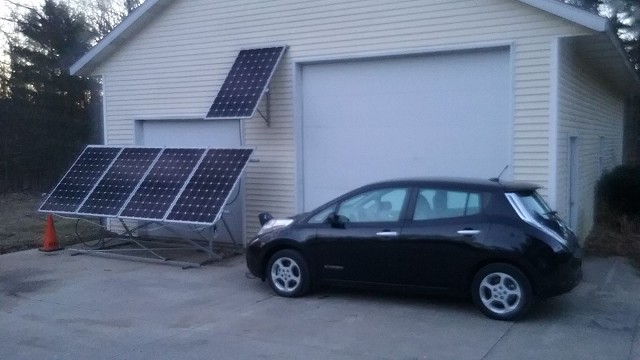 January 2021 Production Report: 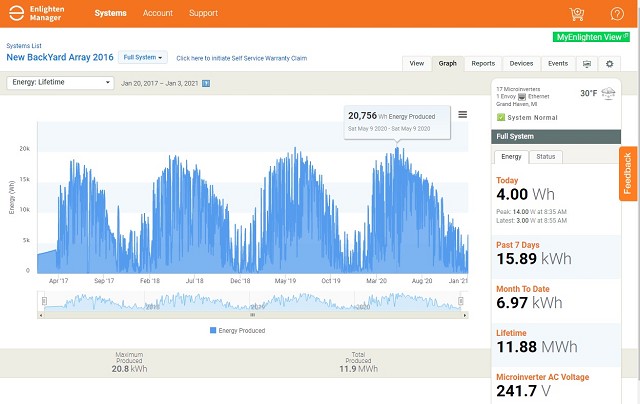 |
|
(Next Page) |
|
Inventing a better tomorrow today... Copyright 2014-2017 Schultz Engineering, LLC |