|
Ideas for Saving Energy at Home |
|
Residential Energy - Conservation December 2013 In December 2013, Menards was selling 60W equivilent LED lightbulbs $6.49!!! In high usage areas, LED bulbs will pay for themselves in less than a year! On December 14, 2013, I switched all the incadescent lightbulbs in my house to LED's. 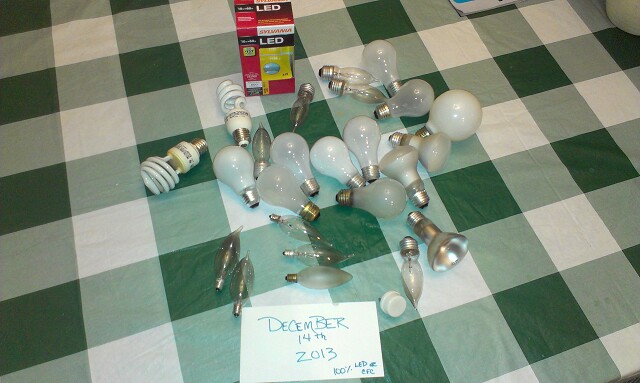 |
|
Residential Energy - Monitoring December 2013 My Electricity Supplier (Consumers Energy) installed a smart meter and provides a website interface to view my homes consumption and compare it to other simular homes. 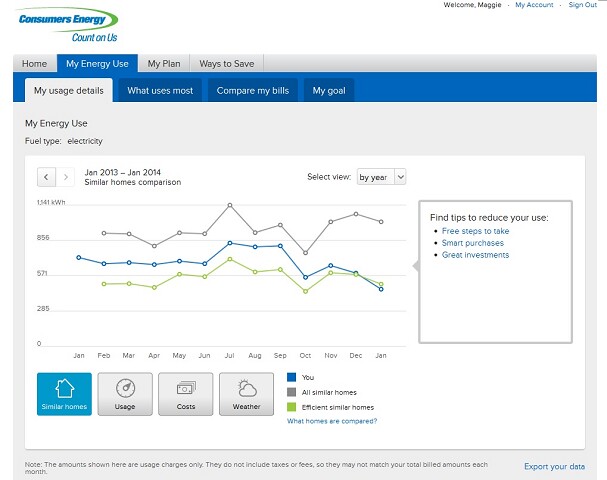 Click Here to see your usage today! https://consumersenergy.opower.com/ei/app/myEnergyUse/usage/bill |
|
Residential Energy - Real Time Monitoring December 2013 Here's a tool that will help you pin point your usage and get it under control with immediate feedback. This will require an electrician (for 5 minutes) to install, but it's an awesome gadget. I plan to use mine first for helping educate my family and eliminating "phantom" loads. Then, I'll use it as a monitoring system when my solar panels are installed. 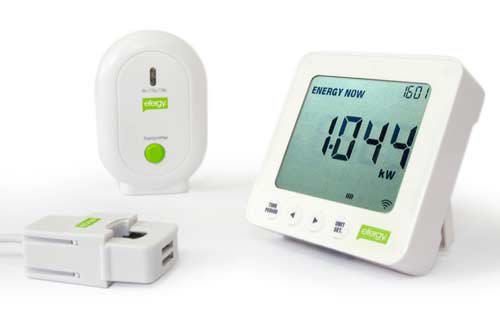 Click Here to see your usage today! http://efergy.com/us/e2v2-wirelesss-monitor Ordered this unit Christmas Eve for my Christmas Present for $102 including shipping from Amazon.com December 31st update: Unit arrived this evening, installed it with no problems in less than 1/2 hour. What an awesome gadget! Discovered my 2 unexpected energy phantom HOGS! A Stereo Reciever drawing 40 watts, and my unoccupied workshop circuit pulling 143 watts, 24/7/365 that equates to 1600 kW per year, or $240 of electricity, MORE energy than my solar panels will generate in an entire year! I went around the house unplugging EVERYTHING and watching my phantom load go down, down, down. Then, I started turning off every circuit breaker in the panel one at a time and then slowing bringing things back on-line making decisions what are needed, what are not. Here's a list of various items and what they were pulling:
The phantom loads are killers because they run so many hours per day! 20 gadgets sitting around plugged in (5W each) will draw the equivilent of 876 kW hours in a year. Some of the gadgets need to be plugged in to charge up (i.e. Cell phones, IPODS, etc.). Could these be on a timer to only charge when the solar panel is producing? Some of the gadgets don't need to be plugged in at all until they are needed. Or they could be on a power strip that is turned off until needed. Energy Usage in January so far with note of peak power drawn of 6.32 kW, I was in the kitchen when this happened. Our electric range and the microwave were running at the same time. 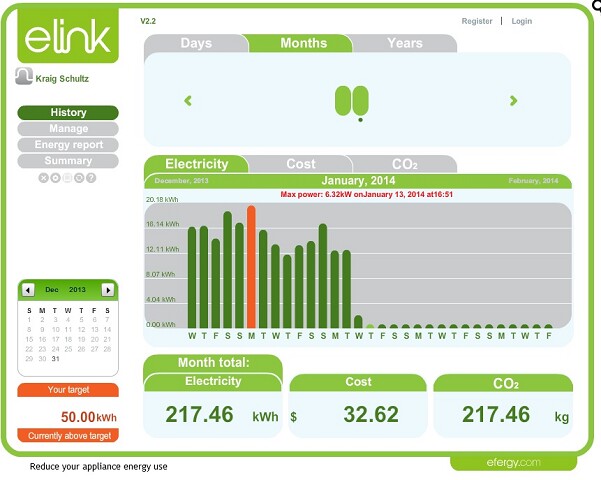 Here is the chart for January 13, it was a low usage day other than the peak at dinner time. 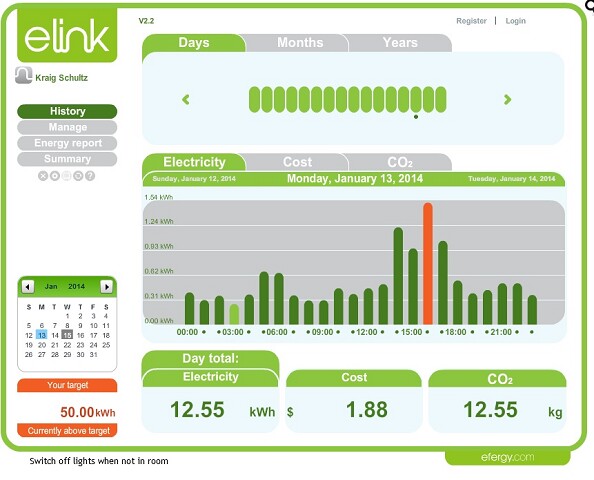 Payback = less than a year! Great thing is it's a real time monitor so everyone in the house can view what's going on with usage. It even has an alarm that can be set to go off when energy use exceeds a certain limit! To view a flyer on the payback of this system, click here. Here's how using this gadget along with installing LED light bulbs has impacted my energy usage in just one month!!! 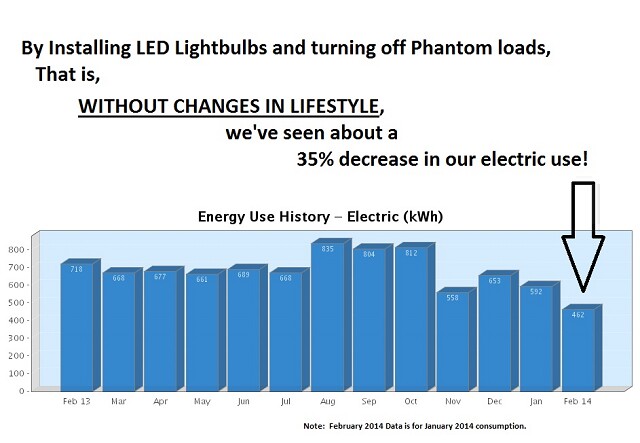 This reduces my monthly electric bill. The top four categories of my bill are for Electricity Itself ($38.71), Distribution ($20.23), System Access ($7.00), Green Generation Block ($1.50). Each Green Generation Block is a 150 kWh block of renewable energy I've volunteered to help subsidize (at $.01/kWh) on my monthly electric bill. 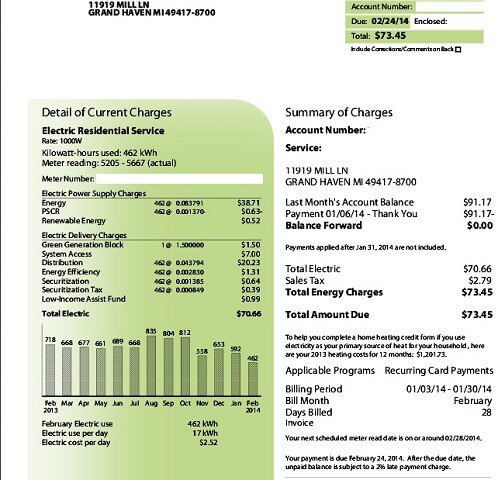 March 2014 Using 50% Less Energy from the Grid!� We've continued our energy slide. In March 2014 (see Aprils Bill on chart below) we used 50% less power from the grid than 1 year ago. 30% less coming from energy efficiency improvements. 20% from the solar panels (they produced 80 kWH in March). In March, we also switched to 100% renewable energy from the Grid by paying $.01/kWh more. Going green has never been easier! 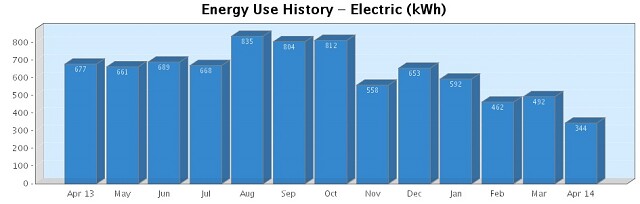 |
Overview of Energy Progress in 2014 - Mill Lane Home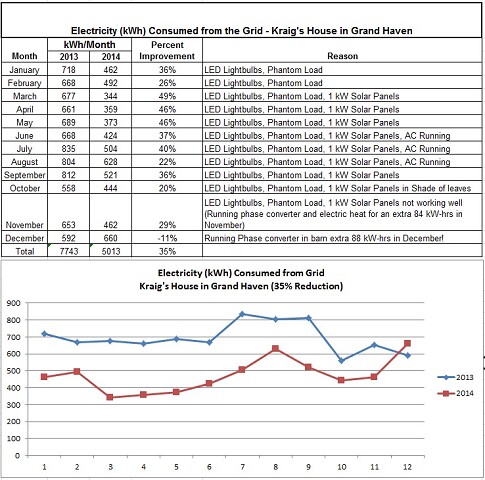 We made significant progress in 2014. The most important progress was learning about our consumption and how well solar panels work. The Efergy meters were the single best investment in 2014. For $100 they helped us learn where our biggest energy users were (both Phantom Load - the Stereo amplifier in the basement that took as much power as our solar panels generate and unexpected energy hogs the 8 kW Phase Converter!!!, the refrigerators, the AC, the forced air furnace, the washer and dryer, the electric range, the electric vehicle chargers). The LED lightbulbs were the second best investment. While we've always tried to turn off lights when not in the room, you know how it actually goes, there's always a few lights that are on that shouldn't be. With LED lightbulbs, this load is cut by 6x. The solar panels were great, and with the Federal Tax Credit, they have a positive ROI. From them we've learned that conservation is more potent than production. |
Energy Project Return on Investment in 2014 - Mill Lane Home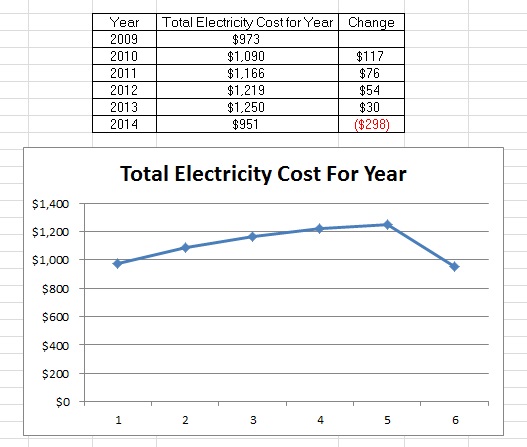 There is no ROI (Return on Investment) if your electricity bill doesn't go down. Here is the total electricity cost per year for the last 6 years at my house. My LED Lightbulbs ($235) and Efergy Meter ($100) saved about $180 of electricity in 2014. My solar panels (cost $3,000 without rebates) produced about $120 of electricity in 2014. Conclusion: My energy conservation investments saved more money than my solar panels. |
Energy Use 2014 - Mill Lane Home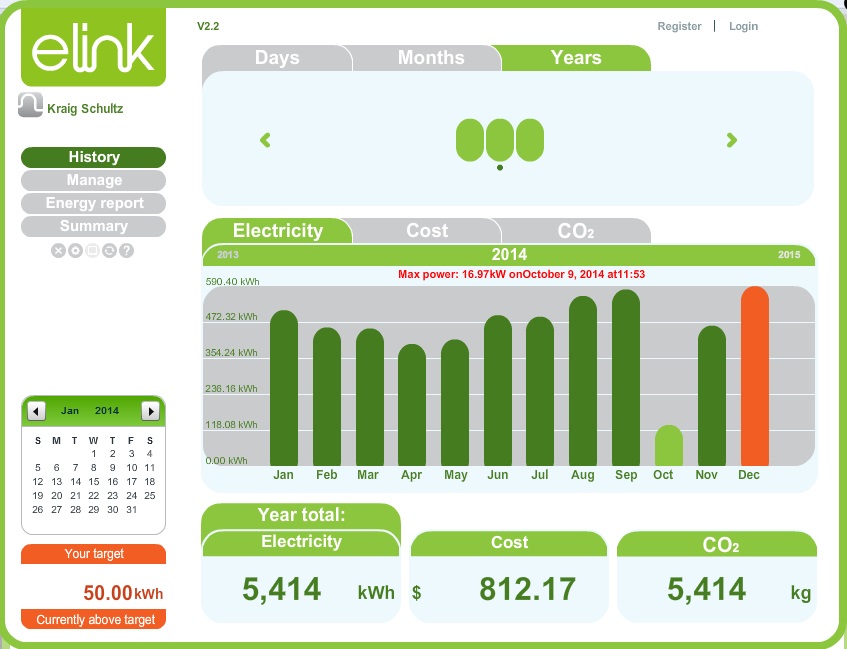 This is the summary of 2014 energy use at my home from my Efergy meter. The month of October is low because I had problems with my wireless transmitter working. I had interferance issues trying to run three wireless Efergy monitors at one location (one on the solar trailer, one on my solar array, and one on my home). Of significant impact is energy used to run the phase converter in the barn. In November when I started running the Phase Converter for some Schultz Engineering projects I discovered that it takes 8kW per hour to run! This is huge! If I run the phase converter for 2 hours, it will use more energy than my entire house uses in a day! The phase converter is a large electric motor that with some electronics that generates three phase electrictity from single phase. I use this to create 220Vac 3 phase and 440Vac 3 phase for running large industrial metal cutting equipment in my toolshop. This equipment is targeted to be sold in 2015 as part of my lifestyle restructuring. But, without the Efergy meters I would never have suspected the phase converter used so much power! I am now very careful about using the phase converter, it is only on when I absolutely need it to be. |
Energy Production 2014 - Mill Lane Home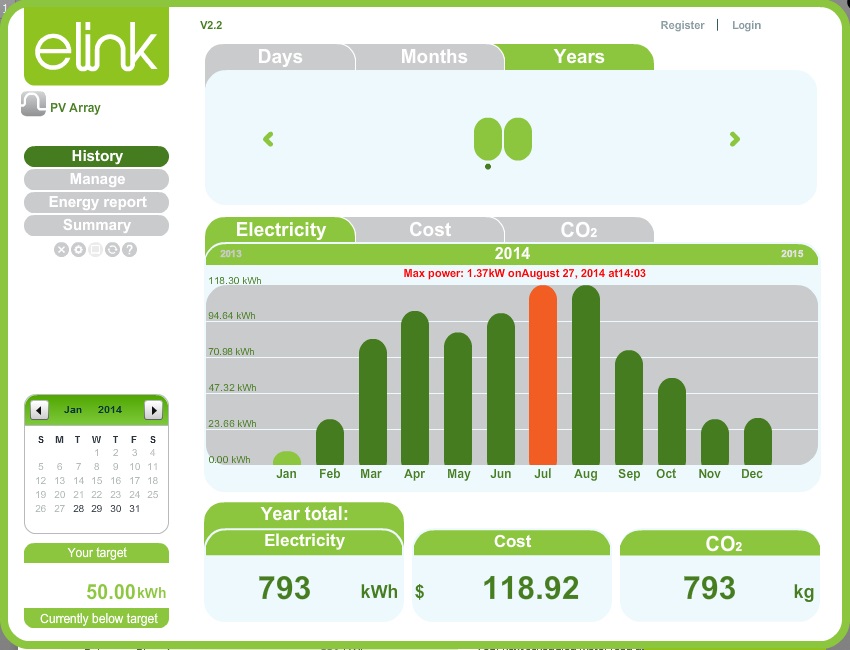 This is a summary of my solar panel production for the year of 2014. The low production in the months of January and February are because the solar panels were functioning only 10 days in February due to the installation and paperwork approvals to become operational. The low production in September, October, November and December are the result of shading in my back yard. I have a lot of trees to the south and they block the sunlight from reaching the panels most of the day. So, when I move to a new home, I'll install the panels in an area that has no shading 12 months a year! Also, in the snowy months there are days the panels are covered with snow. What's amazing is that as soon as the sun comes out, the snow slides right off the panels and they produce lots of power on a sunny winter day. Fall and Winter time negative impact on solar production:
1. Fewer hours of sunlight per day 2. Snow/Ice covering panels some days 3. Many overcast days 4. Sun is very low in sky and so trees/structures far away from panels cast shadows 5. Leaves on trees in fall cast more shadows Fall and Winter time positive impacts on solar production: 1. Reflection off snow 2. When leaves fall off trees, potential for less shading 3. Panels are more efficient in cooler temperature |
|
(Next Page) |
|
Inventing a better tomorrow today... Copyright 2014 Schultz Engineering, LLC |