Kraig Schultz’s Opinions on Aerodynamics and Electric Motorcycles
last updated April 18, 2016(Back to Home)
(Click Here for a Printable version of this page)
|
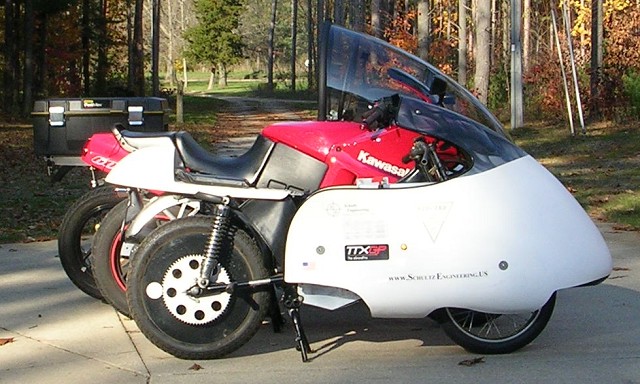
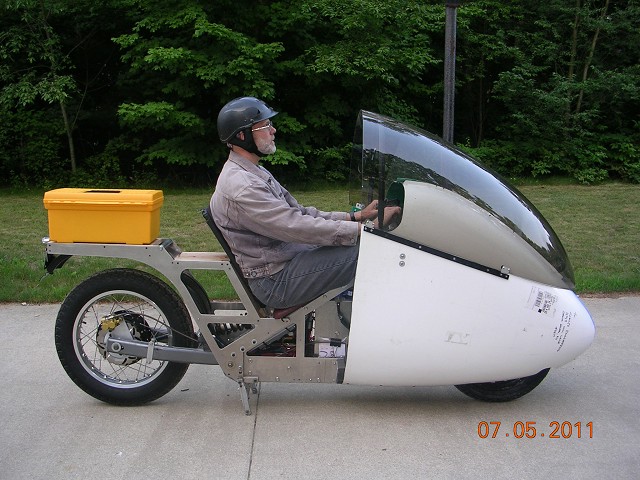
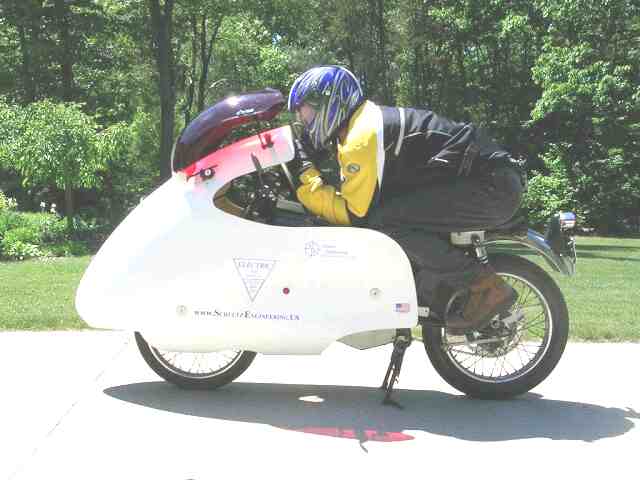
Comparing our 2011 with our 2009 Bike Which bike looks more comfortable to you?
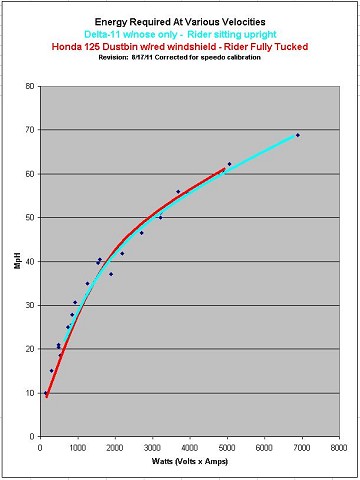  | ||||||||||||||||||||
July 9, 2011- Snapshot of Efficiency of Delta-Bike Models
| ||||||||||||||||||||
|
Cross Wind Stability http://www.schultzengineering.us/cross-wind/cross-wind.htm | ||||||||||||||||||||
|
To calculate how good a streamlined electric motorcycle can be, visit the following link: http://ecomodder.com/forum/tool-aero-rolling-resistance.php | ||||||||||||||||||||
|
In 2012, the Motorcycle Industry Council published several good papers on how to calculate range and top speed of electric motorcycles. These articles contain good information around the subject of motorcycle efficiency. Source: http://www.mic.org/ For City Range: city-range.pdf For Highway Range: highway-range.pdf An excellent paper on calculating Electric Motorcycle Top Speed that includes some benchmarks about how much raw power is required to push an electric motorcycle down the road with formulas to calculate the sources of drag. top-speed.pdf | ||||||||||||||||||||
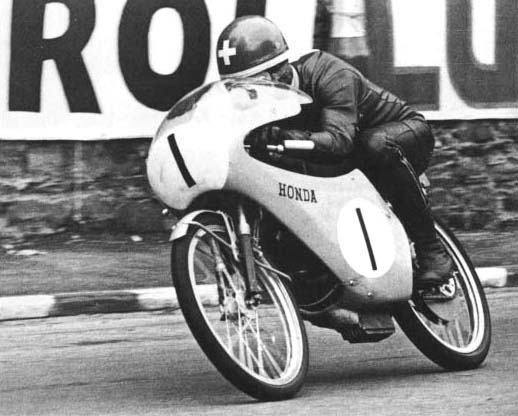
The Picture Above is from http://www.sweetmarias.com/thompsonowen/moto/racers/racers.html Luigi Taveri wins the Isle of Man 50cc TT in 1965. This 33 x 29.2mm engine revved to 19,000rpm and produced 15bhp, topping at 100mph. As of April 2008, electric motorcycles suffer from poor range due to battery technology. Lead Acid batteries offer the best value in $/Kw hours. It is my opinion that instead of spending an extra $2,000 to $5,000 to double the range of an electric motorcycle by installing NiMH or Li-Ion batteries, a person can spend $1,000 on improved aerodynamics (e.g. dustbin fairings) and get better range. After building several faired and un-faired electric motorcycleshere are some of my opinions on Aerodynamics: Power losses due to mechanical and rolling friction is insignificant compared to Aerodynamic drag. Compared to a modern economy car, the aerodynamic coefficient of Drag of a motorcycle is more like a brick with a parachute riding on top than a car. The open wheels and the cooling system are the brick and the rider is the parachute. In order to improve motorcycle aerodynamics we must streamline the brick and minimize the effect of the parachute! To streamline the brick we must round the front corners and gradually close the trailing end. The trailing end may be MORE important than the leading edge. For proven shapes we can observe nature (fish, whales, birds), 1958 vintage dustbin fairings, and human powered vehicles. Electric powered vehicles make our task easier because they require less air cooling. To minimize the parachute we should assume the crouched position or simply put the torso of the rider within the brick! Feet forward designs for bicycles and motorcycles have proven to be superior for minimizing surface area exposed to aerodynamic forces. |
||||||||||||||||||||
|
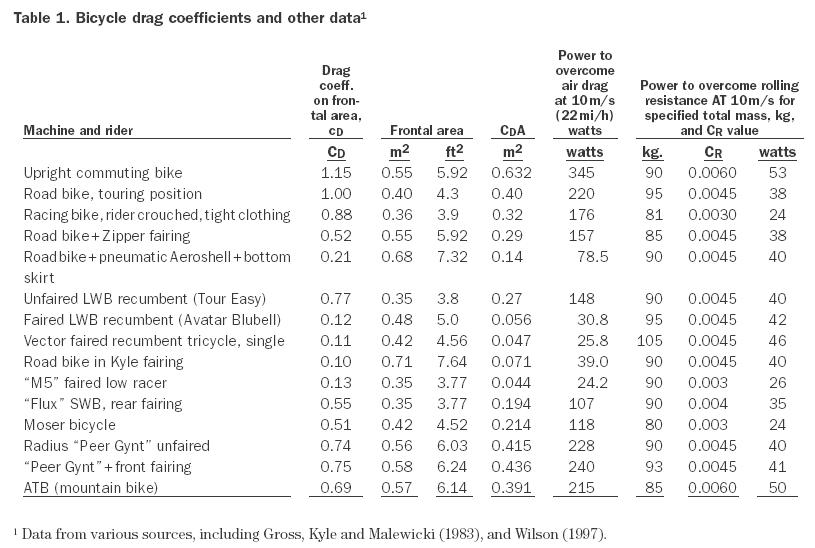
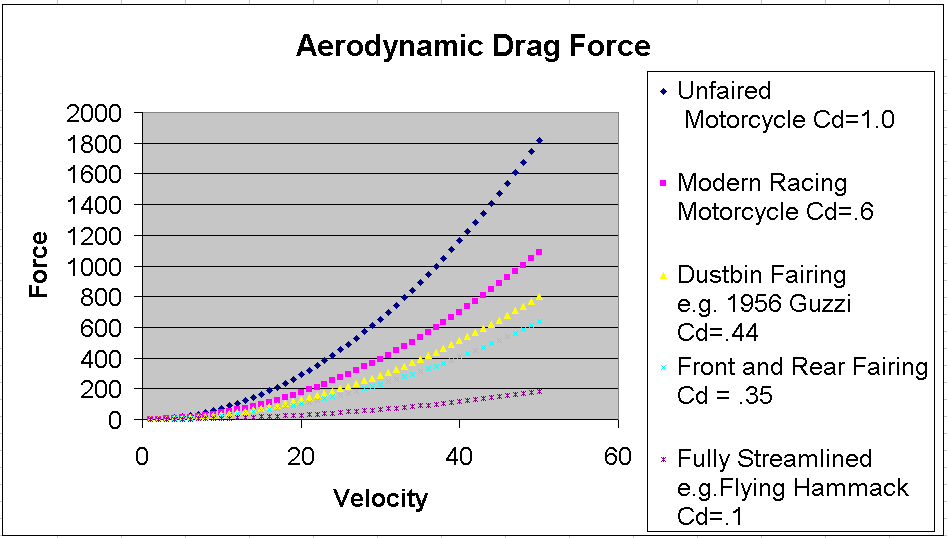
Two excellent resources for learning about Drag Force can be found at Wikipedia (http://en.wikipedia.org/wiki/Drag_coefficient) IHPVA Human Power Issue Number 54 (http://www.ihpva.org/HParchive/PDF/hp54-2003.pdf) Aerodynamic drag for a given velocity can be reduced by reducing the value of two variables: Cd (coefficient of drag) and Frontal (cross sectional) Surface Area. Aerodynamic drag increases exponentially with velocity (Aerodynamic Drag = 1/2(density of air)(velocity^2)(Cd)(Surface Area). Therefore, reducing Cd and Frontal Surface Area offers enormous energy savings for even slight increases in velocity. Cd is the unit-less number that quantifies the effect of the bodies shape on how air will flow around the body. The product of Cd and Area is typically referred to as “CdA”. For example, two cars can have the same Cd of around .3, but the one with more frontal/size surface area will have higher drag forces. To minimize drag forces we want to minimize Cd AND effective surface area. We do this by building the vehicle with an aerodynamic shape and keeping it as small as possible. Another aspect to consider is energy lost to the friction as air passes over the surface of the vehicle. Sometimes referred to as wetted area. The total surface area of the skin of the vehicle is rubbing against the air causing friction and turbulence. For this reason, vehicles are commonly sanded very smooth. However, there is some evidence that perfectly smooth may not always be the best surface. It is very important for the air to flow smoothy around the vehicle and then gently recombine behind the vehicle. When the surface makes fast bends the air might not stick to a smooth surface and become "separated" and this causes more lost energy from turbulence than would be lost to friction. In aircraft and in fish (for example the ribs on side of a Shark and the scales on the skin of a fish) turbulators are used. Turbulators are bumps added that cause the air to stick to the surface and if designed properly can channel the air so that it doesn't separate on the trailing edge. For ground vehicles, another consideration is energy lost to air that is pushed against the road. If not properly designed air can be pushed into the road by the nose of the vehicle. Air that hits the road is trapped and bounces off and causes lots of turbulence and friction as the surface of the road is typically not smooth. Two easy ways to avoid this, are to keep the vehicle off the ground by at least 8 inches and/or to direct air sideways around instead of under the vehicle. | ||||||||||||||||||||
|
SOME RUMORS AND HEARSAY: I've heard that with streamlined Human Powered Vehicles when a competitor gets close behind a leading vehicle they can interrupt the smooth recombination of the air and can cause significant energy loss to the leading vehicle. So drafting in streamlined vehicle races is discouraged...If you have data on this, I'd like to get some... | ||||||||||||||||||||
|
ACTIVE Verses PASSIVE Streamlining: I once watched a TV show on PBS that discussed aerodynamics of supersonic airplanes. They talked about passive and active streamlining. Passive is where you just focus on making the shell of your vehicle streamlined. Active is where the surface of the vehicle is perforated and air is pumped through the perforations in such a way as to Dramatically reduce aerodynamic drag. The statement was made that active streamlining has not been practical because it is too expensive. I'm interested if anyone has practical experience applying this to ground transporation vehicles. Please E-mail me if you have some input. Some thoughts from Jan Schoonderbeek on this subject in April 2011:
There is work being done at NASA on this technology. It is called Passive Porosity Technology (Pass PorT). Technical paper AIAA-2001-2412 from the American Institute of Aeronautics and Astronautics entitled, "A Boundary Condition for Simulation of Flow Over Porous Surfaces", talks about progress in modeling this technology. The paper indicates that Pass Por T actually works and can communicate high/low pressure from one side of an aeronautic structure to the other without much actual air flow through the structure. This technology can change the performance of an airfoil or wing without changing its shape and so it should help a vehicle be less affected by cross winds and buffeting from passing vehicles, and it can also help reduce separation from the boundry layer at the rear of the vehicle. Here is the abstract of the patent for this technology: http://ia600509.us.archive.org/3/items/nasa_techdoc_19920021144/19920021144.pdf "As it so happens, I've studied aerospace engineering back in the nineties, and this subject has been mentioned during aerodynamics classes. Entirely from memory: the professor mentioned active suction of the boundary layer on wing surfaces. This means that skin panels in surface areas were perforated with patterns of tiny holes, through which a pump in the aircraft sucks in air, expulsing it again in some wake area (e.g. the end of the fuselage, or an engine nacelle). Varying the pattern of the holes and the density of the holes (number of holes per unit of area) could locally/selectively influence the effective streamline. The suction of air from surfaces results in:
This reduces/eliminates the wake surface area, reducing drag even more (essentially wake drag is about Pdyn x Aw where Pdyn is the dynamic pressure and Aw is the wake surface area) and also increases the maximum angle of attack of the surface area, which is handy to reduce the minimum airspeed. The effects of this active streamlining were quite positive. However, in aircraft, this technology was not economical, since it requires expensive machining of skin panels, and a costly (money/weight/power) installation to move the air through the airframe. As I mentioned, this is from memories from the last millennium, so it may not be entirely accurate. Furthermore, technological developments may drive down the cost, while economical development may increase the potential gains. Maybe we'll see the technology on aircraft in the future. For motorcycles, I would guess this technology not to be very effective, for the following reasons:
On the other hand, quantitative data on motorcycle aerodynamics is amazingly scarce... " 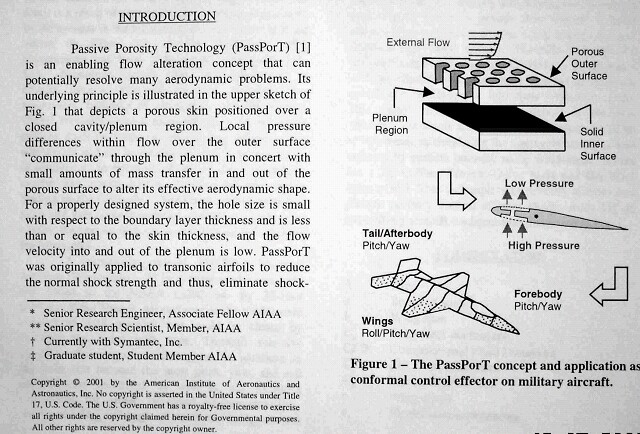 |
||||||||||||||||||||
Typical Cd values include:
Automobile examples of CdA ft˛ are shown below (For more examples visit http://www.mayfco.com/tbls.htm)
|
||||||||||||||||||||
Kraig Schultz’s Electric Motorcycle (4-1-07) without a fairing. Formally a Honda CB-125. Estimated Cd=1.0
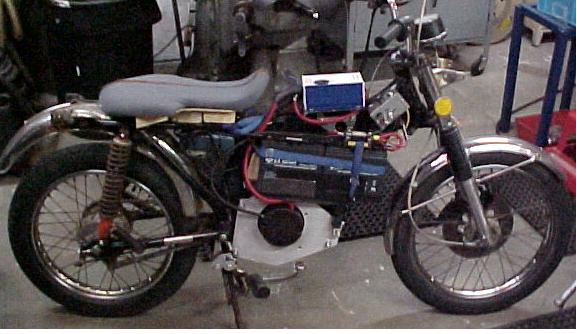 Here's the same bike a 2 years later. Estimated Cd = Better 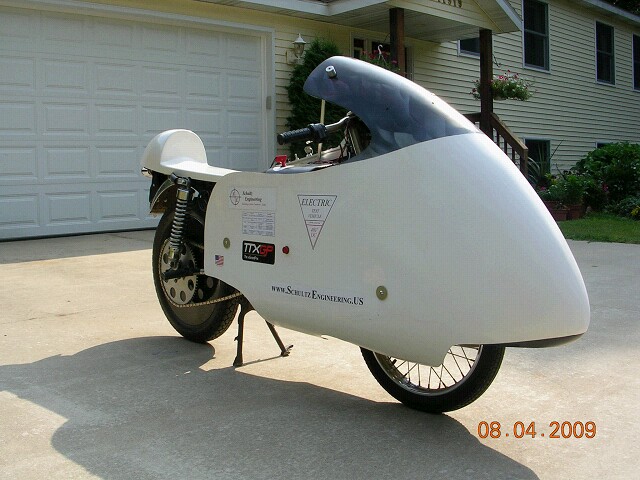 |
||||||||||||||||||||
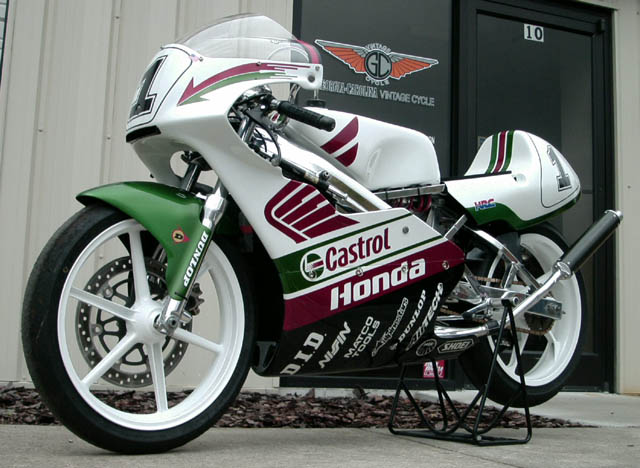
Modern sport/racing bike. Estimated Cd=.6
Picture from this source
 |
||||||||||||||||||||
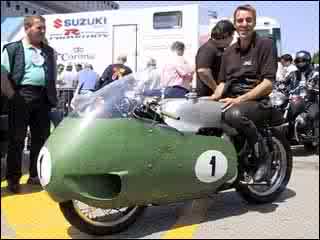
1957 Guzzi motorcycle with dustbin fairing. Note: Dustbin fairings were banned from motorcycle racing in 1958. Wheels up to their axles and riders arms and legs must now be visible from side view and not covered by aerodynamic fairings. Cd=.44
 |
||||||||||||||||||||
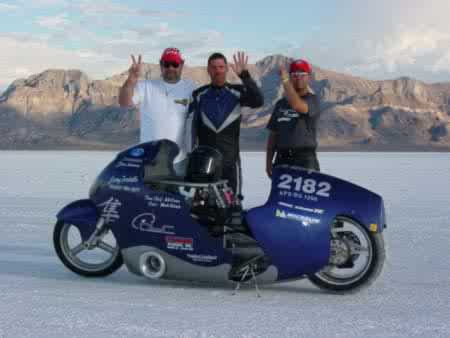
Modern attempt at land speed record without using dustbin fairings (covering rider, front or rear wheels) This motorcycle attempts to conform to motorcycle racing rule definitions of “motorcycle”. Estimated Cd=.36 Picture Source
 |
||||||||||||||||||||
|
NSU's streamlined motorcycle with Cd of .1 From Vic Willoby's book Exotic Motorcycles… "A vehicles's Cd figure...expresses its resistance as a proportion of that given by a flat disc of the same frontal area. In those terms, the air resistance of the flying hammaock was equal to that of a flat disc of 6.75 inch diameter - say, an old-fashioned headlamp glass!" 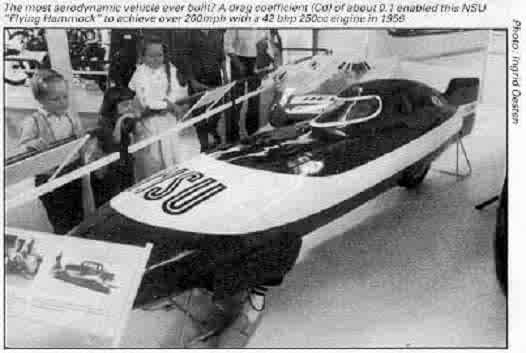 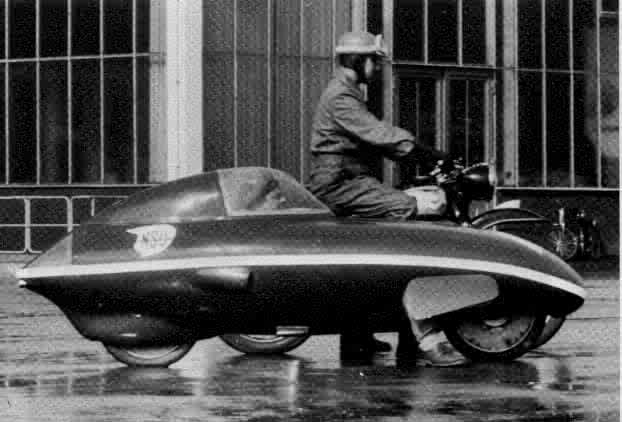 Small frontal area is equal in importance as Cd. Reduced frontal area is accomplished by good engineering. Here Vic Willoby demonstrates the comfort and stability of the flying hammock (by riding no handed) without it's bodywork in place. Picture Source: Exotic Motorcycles by Vic Willoby. 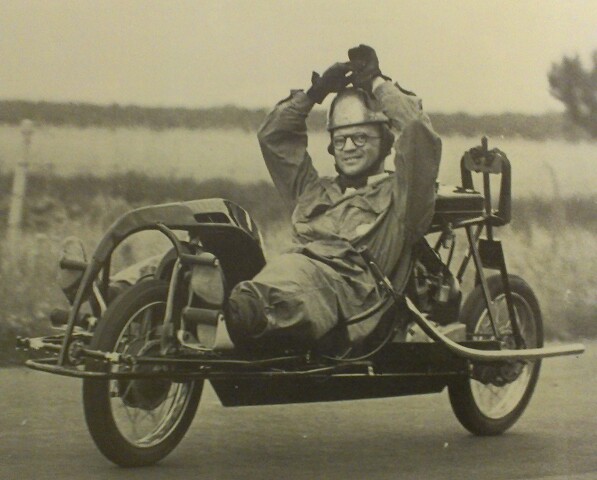 |
||||||||||||||||||||
|
This excellent graph shows sources of resistance at 100kph (62mph) Comparing a normal motorcycle to the Fully Streamlined (Thriftyness) version: Luftwidersand (Air Resistance), Getriebe (Transmission), Kette (Chain), H-Rad (H-Wheel), V-Rad (V-Wheel): Image from: http://www.eurospares.com/graphics/NSU/Baumm008.JPG 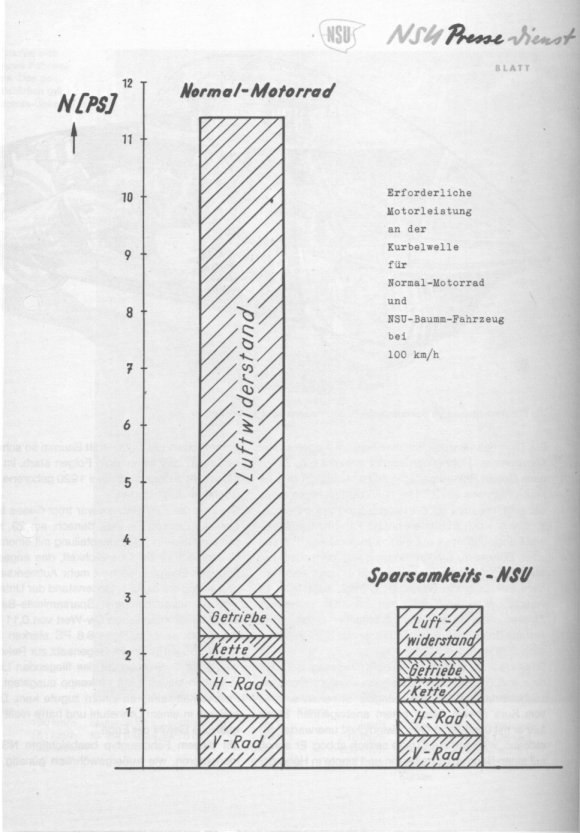 |
||||||||||||||||||||
|
World Speed Record for Human Powered Vehicles is currently held by Sam Whittingham. He raised the record to 82.4 mph (2009) in the Varna Tempest. through a 200 meter speed trap. He has riden the Tempest 56.2 miles in 1 hour on human power only! The Tempest fits Sam like a glove. It is a tiny little vehicle, light-weight and with super skinny tires. And it's the fastest human powered vehicle in the world! Here is a link to a news video about Sams type of vehicle. http://www.varnahandcycles.com/video/FastestHPV.wmv
The picture here shows a simularly shaped Varna Mephisto with Sam Whittingham as power that attained 73.34mph Cd=.1 Picture Source 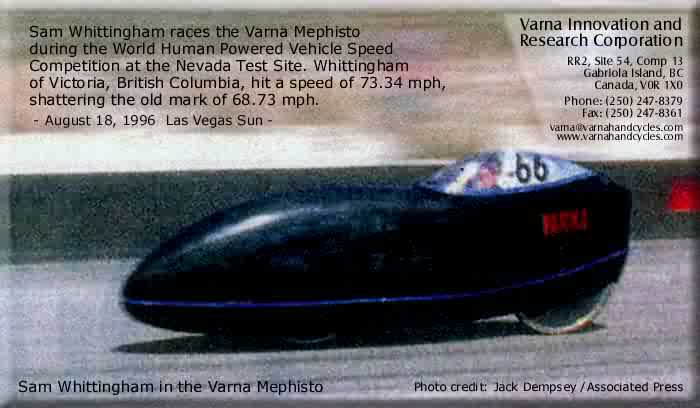 |
||||||||||||||||||||
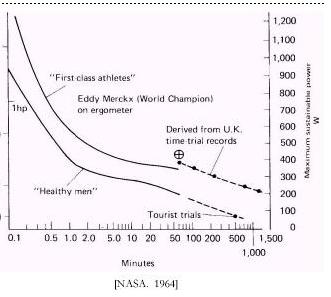
The following chart shows what kind of power is available from humans. Keep in mind that one horsepower equals about 746 watts of energy.)
 |
||||||||||||||||||||
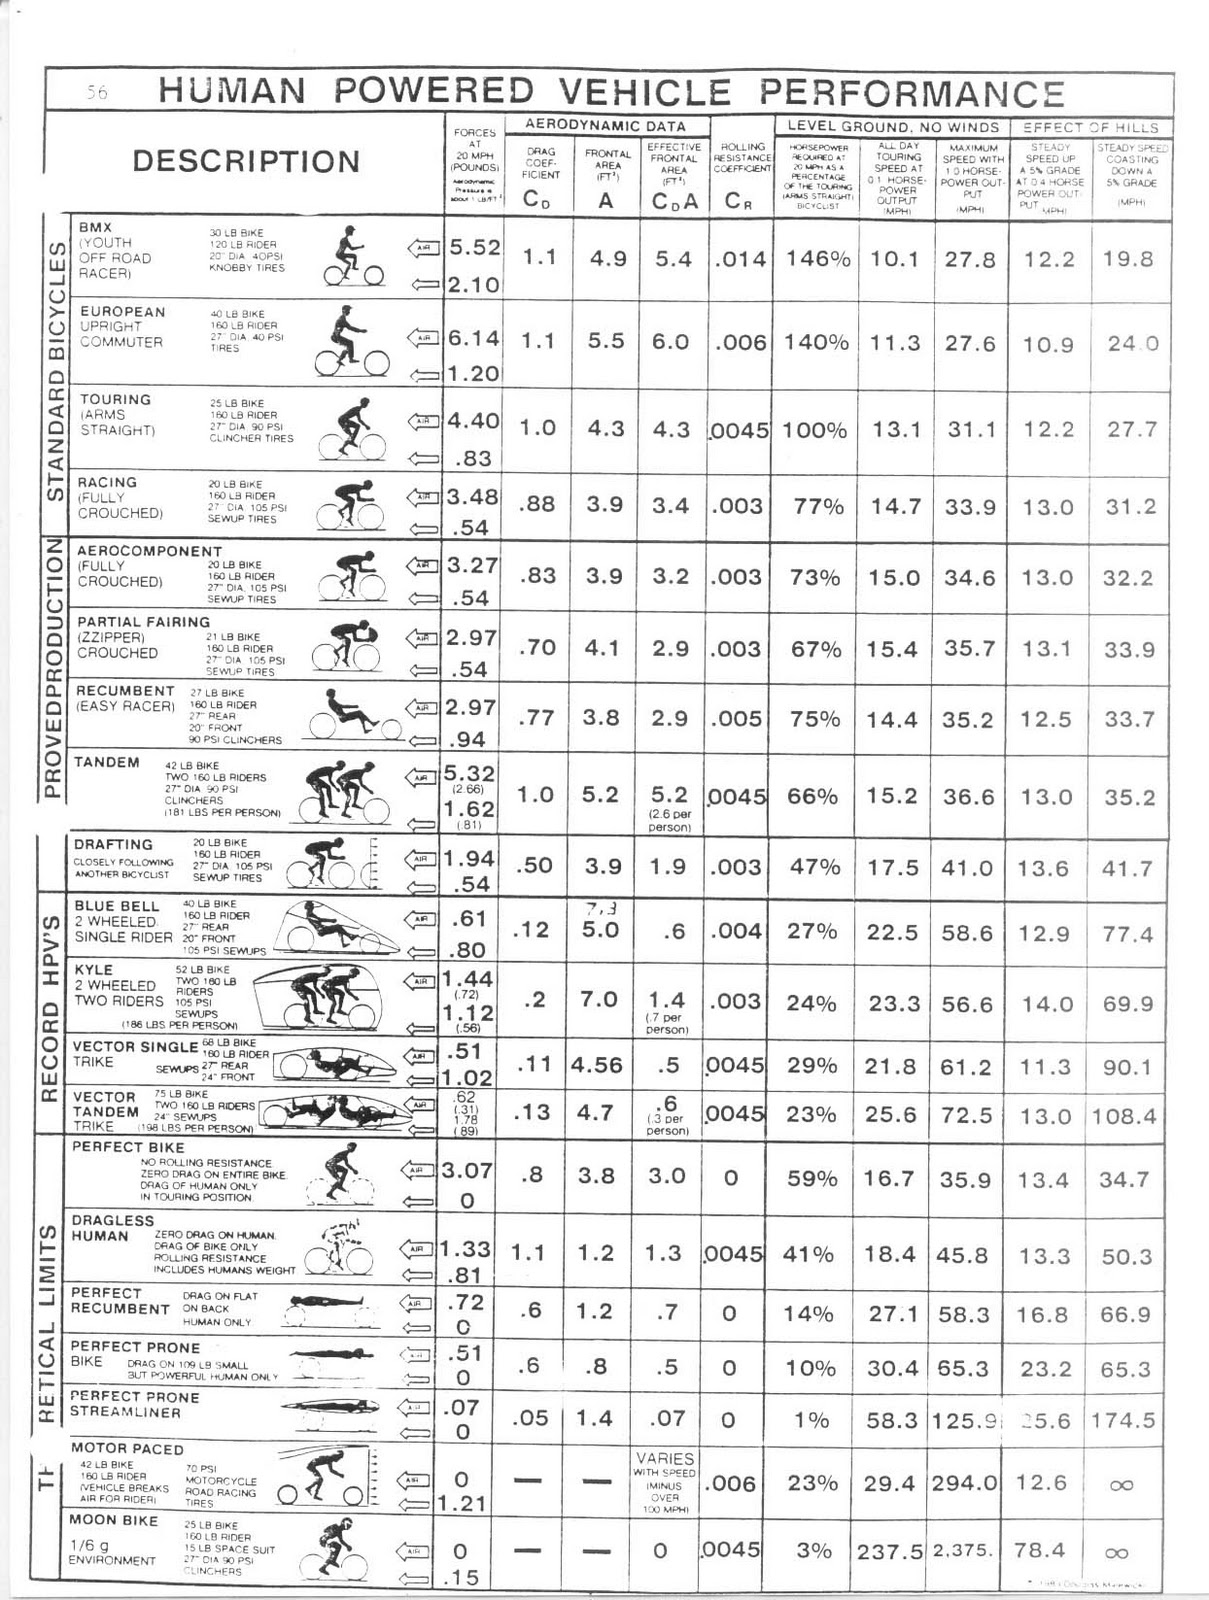
The following chart if from IHPVA Human Power Issue Number 54 (http://www.ihpva.org/HParchive/PDF/hp54-2003.pdf)
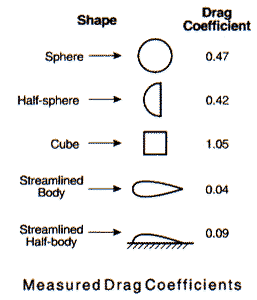
 The following chart comparing different shapes with pictorials is from the following source: http://4.bp.blogspot.com/_urSQl6wUA5g/TTZFTUOs6FI/AAAAAAAAIe8/zeE_bHhBpOE/s1600/drag_chart.jpg 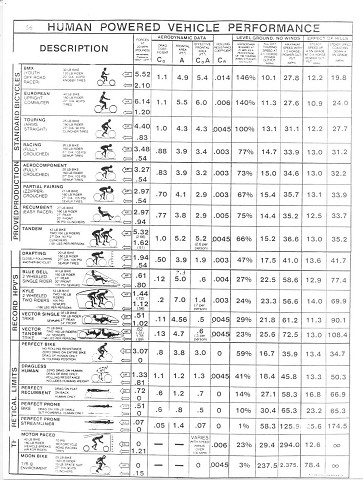 |
||||||||||||||||||||
|
Opinions from the following forum:
http://endless-sphere.com/forums/viewtopic.php?p=1501&sid=2e9836f39fbf4b3d27d57c50f680c02c In the early days people tried completely wrap around fairings, but people crashed whenever a strong wind hit them from the side. They realized that if they limited the front fairing to the center of the front wheel (vertically) and on the rear to the back of the rear wheel that you could mostly prevent this danger. It's not a bad rule... it's accepting reality.... My opinion is that you want to get "good" aerodynamics and not seek after "perfect" aerodynamics. A little streamlining goes a very long way. The main thing is to get the "tuck" position (right there you cut your frontal area by about half) and get some smoothness in the front to keep the air out of the "pocket" that forms between your arms and chest area. That "pocket" generates a HUGE wake. It's like riding a "concave shape" (edges facing forward) into the wind. Really bad... ...and consider that a regular bicycle has the aerodynamics of a "cube" at about "1" if you can simply get to the level of a "half sphere" you can cut things in half. The fully streamlined shape can get as low as "0.04" which is WAAAAAAY better than the "half sphere", but it doesn't change the fact the we were starting from a "cube" shape. Perfection is the enemy of "good enough". |
||||||||||||||||||||
 |
||||||||||||||||||||
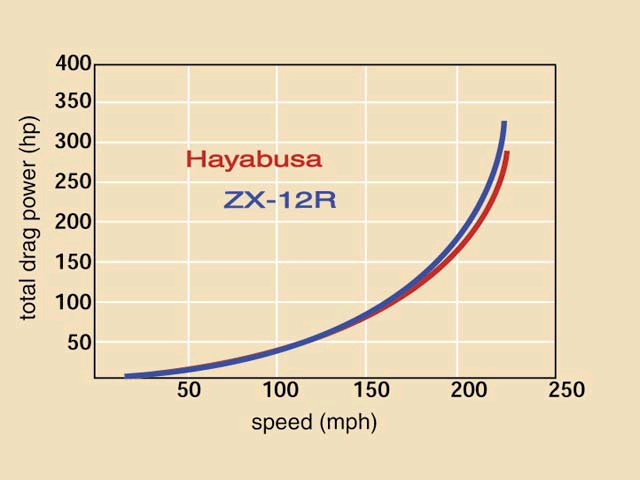
Comparing the 2 fastest street bikes in the world: What makes the Suzuki Hayabusa faster than the more powerful Kawasaki ZX-12R? A visit to the National Research Council wind tunnel provides the answer…
Picture Source
 |
||||||||||||||||||||
|
“The ZX-12R has a frontal area of 6.09 ft2 (0.566 m2), physically larger than the Hayabusa, which is 6.01 ft2 (0.558 m2 ). But the advantage for the Suzuki is not just in frontal area. With figures for both drag and frontal area, it's possible to calculate the coefficient of drag, which is 0.603 for the 12R and 0.561 for the Hayabusa. The winner of this wind tunnel shootout is the Suzuki. It's worth remembering, however, that neither of these CD figures indicate a particularly impressive degree of streamlining, since even a typical passenger car has a CD of less than 0.60 and some models are lower than 0.30. A fully streamlined Bonneville speed-record bike might have a CD of 0.10. Such is the nature of streetbikes, where performance derives mostly from extreme power-to-weight ratios. One of the most striking, and controversial, elements of the Hayabusa is its prominent, drooping snout. Is it possible this unusual shape contributes to the Hayabusa's more slippery aerodynamics? Not according to Cooper, who says one of the enduring misconceptions about aerodynamics is that a sharp, projectile-like nose produces less drag. He offers the example of a brick, which, once the leading edges have been smoothly rounded, can only achieve significant reduction in drag from changing the shape of its back end to minimize the wake size (the same reason a fairing that closes in is superior)… The most immediate way to decrease drag on a motorcycle is for the rider to adopt a crouched position. A smaller rider can produce a 15 percent reduction in drag; tight clothing, which reduces the "balloon effect," can provide another 15 percent reduction. Motorcycles generally have a large separated wake resulting from the unstreamlined shape of the rider, and are called "bluff bodies." Streamlined bodies have a gently closing tail and a very small wake, reducing the pressure drag. Motorcycles designed for speed-record attempts, and to a lesser extent racebikes, typically have enclosed shapes or bodywork that is integrated with the rider's body to produce a smoother wake. For streetbikes, however, styling conventions and comfort demands make this sort of approach impractical.” This is a quote from the on-line article comparing the aerodynamics of the worlds 2 fastest motorcycles found at http://www.sportrider.com/tech/146_0106_aero/ |
||||||||||||||||||||
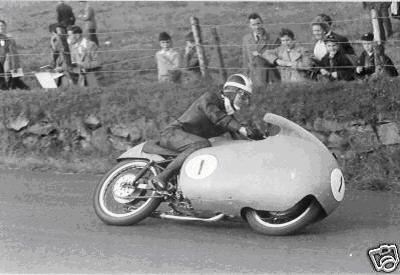
Bill Lomas on a 350cc Moto Guzzi Bialbero dohc single cylinder factory racer during the 350cc Ulster Grand Prix of 1956. Bill Lomas would win the race with an average speed of 90.26 mph (145.26 km/h ). He also recorded the fastest lap with 4 minutes and 51 seconds. Good for an average speed of 91.74 mph (147.64 km/h). He went on to win the 350cc world championship with the photographed machine in 1956!
 |
||||||||||||||||||||
|
Craig Vetter's mileage competitions in the early 1980's showed that streamlining can drastically improve motorcycle fuel economy (i.e. Bikes used in this competition were getting 60-70 miles per gallon unmodified, but with fairings and other tuning were getting 200-350 miles/gallon). The picture below shows Charly Perethian's 282 miles per gallon 185cc Yamaha. Various bikes using this fairing got up to 470 miles/gallon during the Craig Vetter Mileage competition1985. The riding velocity for the competition was typically over 60mph for 60 or more miles on the road AND on the track. This fairing design can still be purchased from Craig Vetter at the following website http://www.craigvetter.com/ 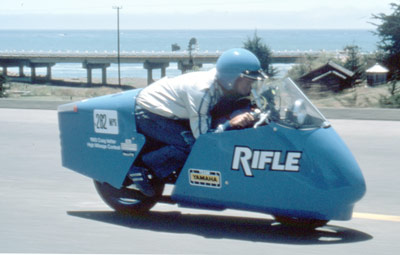 Here's some comparison that I suspect came out of Cycle World Magazine, but I snatched the pictures from the following site http://ecomodder.com/forum/showthread.php/motorcycle-aerobody-research-26249-3.html 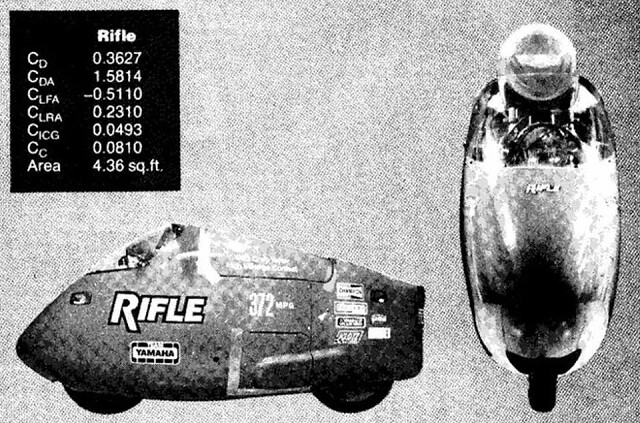 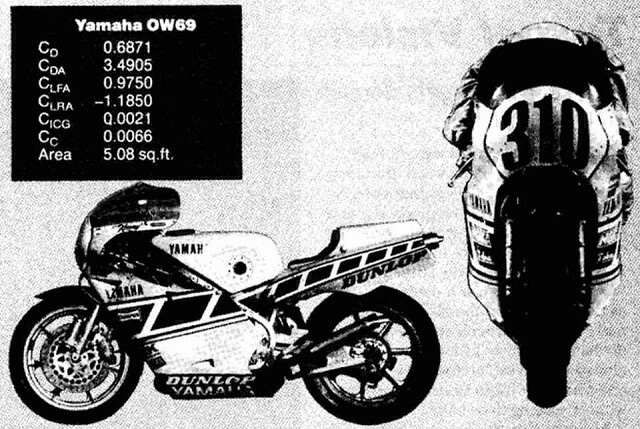 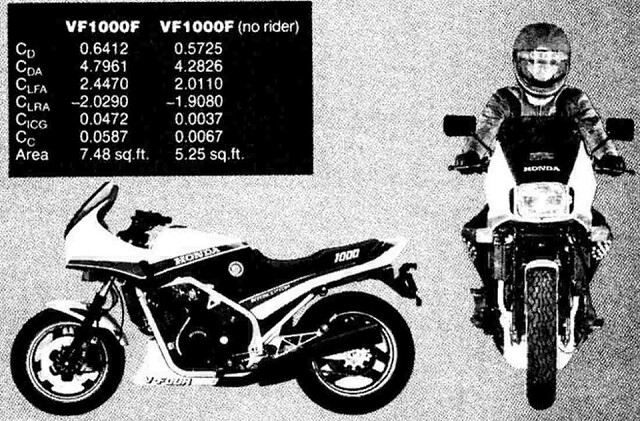 |
||||||||||||||||||||
Old Racing Pictures If only dustbin fairings hadn't been banned from racing!!! 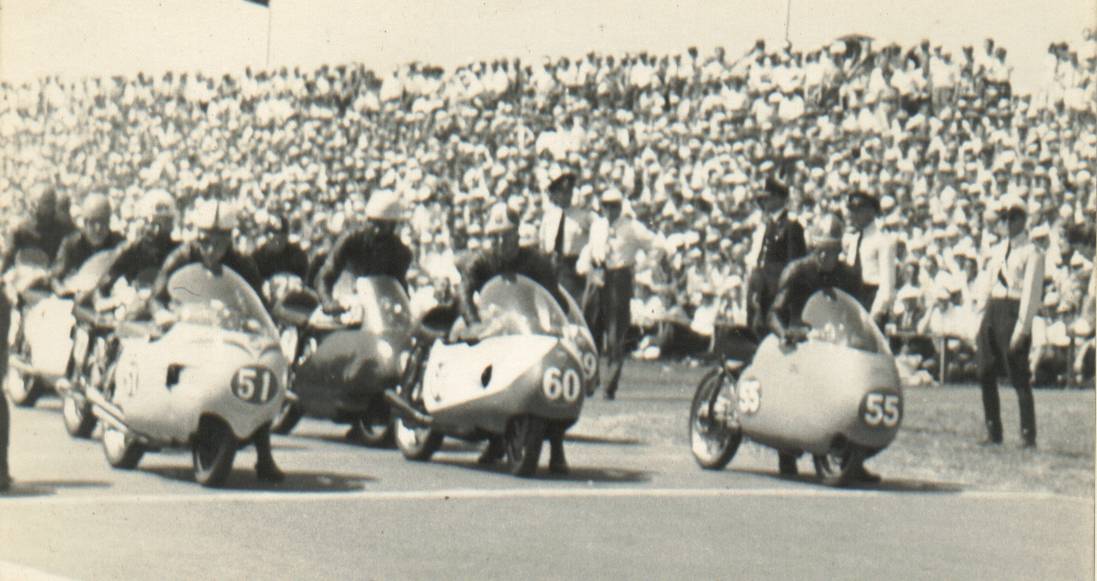 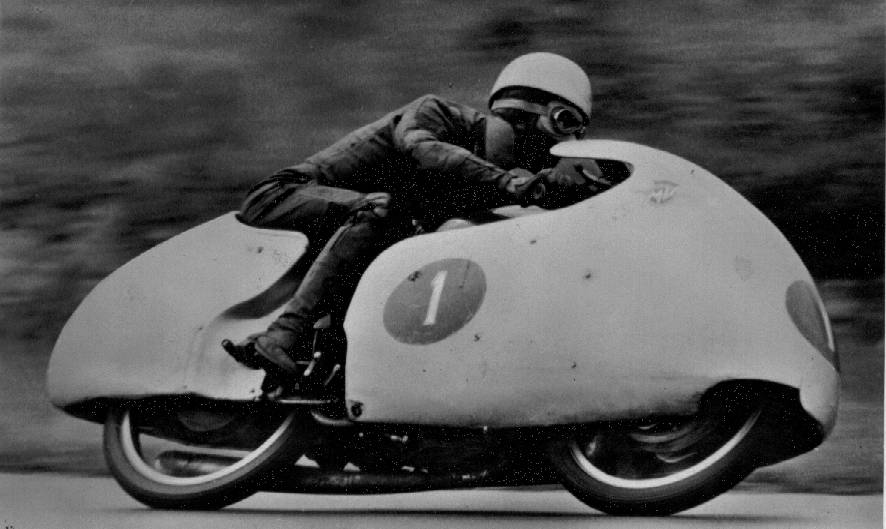 |
||||||||||||||||||||
|
For More Proof Click Here The short story of how Gustav Baumm Died showing us the way! From Mick Walker's German Racing Motorcycles By Mick Walker In 2008, Englishman, Cedric Lynch is alive and kicking. He has ridden his homebuild enclosed bike over 40,000 miles. It goes 150-200 miles on a single charge of its 100 amp-hour, 55 volt battery pack traveling at 50 mph!!! Talk about a modern day hero! Instead of bailing out the banks and the auto industry giants, maybe we should fund a few geniuses instead? He's running high pressure mountain bike tires, so he has low air resistance and low rolling resistance. The video shows a slight glimpse of how he gets out of the vehicle. It's interesting that the windshield buckles to allow the side door to open. http://agnimotors.com More pictures of Cedric's Bike http://www.bikeweb.com/image/tid/57 April 7, 2012 update from Cedric: "I recently heard about a wonderful instrument called the Cycle Analyst, and have bought one and fitted it to my bike. It nearly always shows an energy consumption of 15 to 16 watt-hours per kilometer, 24 to 26 watt-hours per mile. It seems to make little difference whether I am riding in town traffic or at a steady 50 to 55mph on a main road. The bike has regenerative braking, and the Cycle Analyst shows this to be regaining 12 to 17% of the energy in town traffic but much less on the main road (obviously zero if the main road did not have any hills on it). I get most of my charging from 160 watts of solar panels on my house roof." 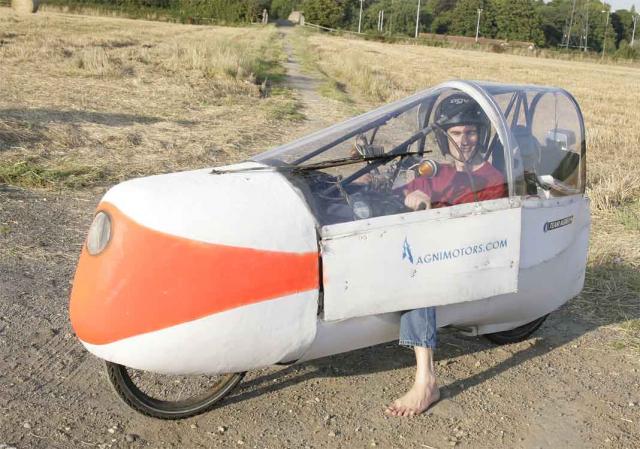 |
||||||||||||||||||||
|
Mostly Enclosed Honda Innova 125i Allert Jacobs project in the Netherlands Watch the Video of his benchmarking against a stock Honda: http://www.youtube.com/watch?feature=player_embedded&v=a0NRW7_B2Ug On his blog you can read, "Summer is here again, now is the time to ride comfortable and fuel economical. I rode a tour together with a stock Innova rider just to determine the difference in fuel consumption that the streamline would make. Riding together ensures us to ride the same route under the same weather end traffic conditions with the same speed and acceleration. Sunny weather, 80F, little wind, a 3 mile traffic jam on the highway, got stopped by the police once. A distance of 165miles total (according to GPS) 25 miles on the highway the others on local roads, average speed of 37mph. Fuel consumption stock Innova: 130mpg Fuel consumption streamline Innova: 221mpg For the record; both bikes have the stock PGM-FI type engine, the only difference is the taller gearing of the streamliner. After we did this first ride on local roads we were curious about the difference in fuel consumption on the highway at a steady speed of about 55mph. Therefore we rode again this time with cloudy weather, an occasional mild shower, little wind and 65F. We did 60 miles one way, turned and rode the same highway back. Total distance 127 miles according to GPS, this is 2% more than the mile counter of the Innova recorded, so it has actually been doing 2% better mileage all the time. Average speed according to GPS 53mph. Fuel consumption stock Innova: 113mpg Fuel consumption streamlined Innova: 237mpg The streamline more than doubled the mileage of the bike at that speed. And this was the first time that I managed to get to the magic number of 100km to 1litre (235mpg) riding about 85mph. This ride proves it is possible in favourable conditions."  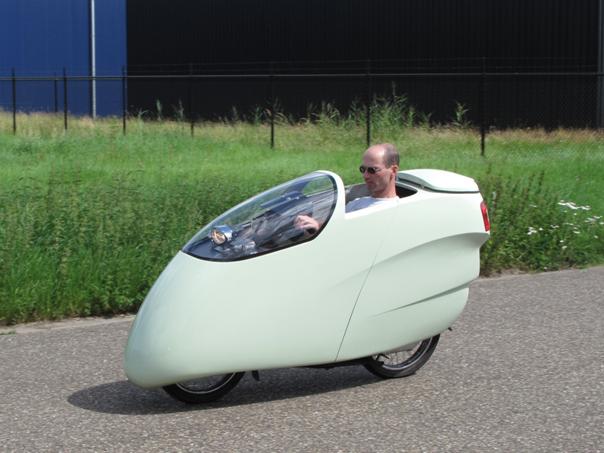 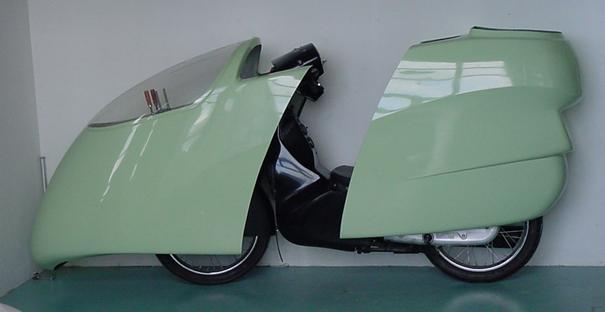 |
||||||||||||||||||||
|
Partially Stream-Lined Honda Innova 125i A Project by Dr.-Ing. Wolfgang Bauer of Germany Through close attention to frontal area and compensation for air flow in front of and behind the rider, this gentleman doubled the fuel economy of a Honda Innova 125i. Watch videos of his bike in action at: http://www.myvideo.de/Community/Mitglieder/Profil?searchMember=9167550 The prototype evomoto 125cc is based on the Honda model Innova 125i. The modifications enabled a 60% reduction in aerodynamic drag, resulting in a 40% increase in top speed (now 130kph, 80mph) and a 50% reduction of fuel consumption (now 1 litre of gasoline per 100km, equal to about 234mpg). Cd x A = 0.21 m2 (EVO MOTO) improved from .57 m2 (Stock Innova). His average fuel economy in commuting can be viewed at http://www.spritmonitor.de/de/detailansicht/446021.html. It shows the fuel consumption in everyday riding conditions including rain, storm and traffic jams with a daily commute to work in the summer of 74 miles. He's averaged 215mpg in over 12,000 miles of riding as of December 2012. It's obviously a very capable vehicle. 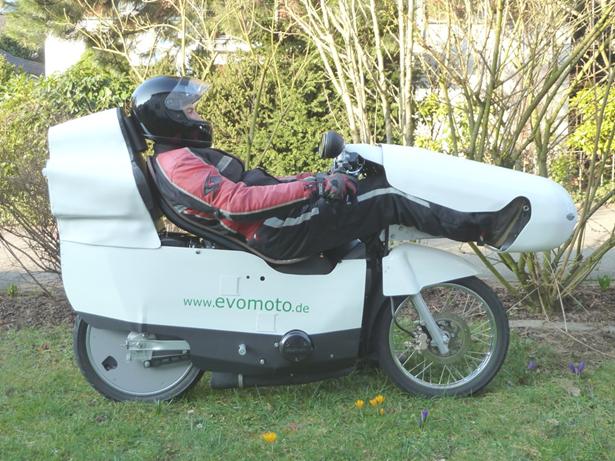 |
||||||||||||||||||||
April 2011 update: Schultz Engineering is building a new concept vehicle taking all this information and trying to make a practical vehicle. It's call the Delta-11, it uses the Vetter-Rifle Fairing that won the Vetter Fuel Economy Challenges in the 1980's. Learn more at www.schultzengineering.us/delta-11.htm. Here's a concept picture.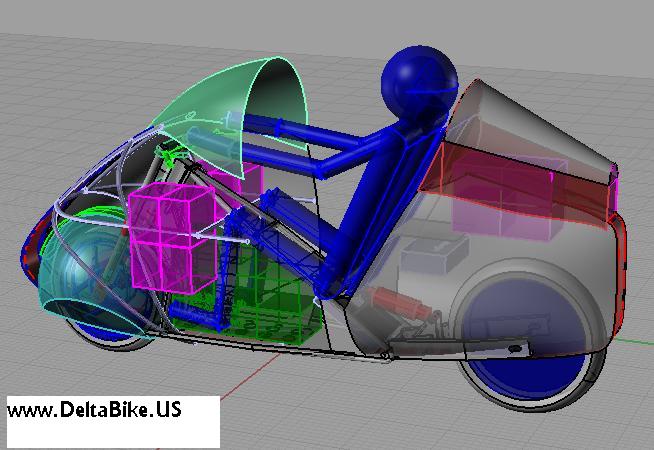 October 2014 update: The Delta-11 prototype now has over 11,500 miles on it. It has a lifetime average fuel economy of over 350 MPGe, (81 Wh/Mile from the wall) (see EcoModder for data). 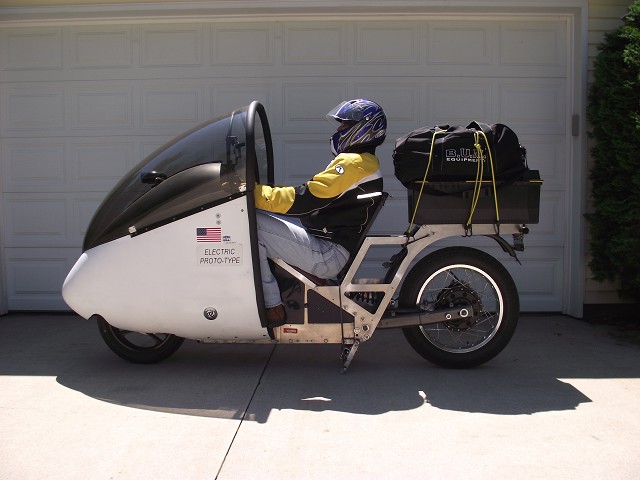 October 2014 update: Due to it's high efficiency, the solar panels shown provide enough power (100 kWh) for the Delta-11 electric motorcycle to travel 1,200 miles a month. 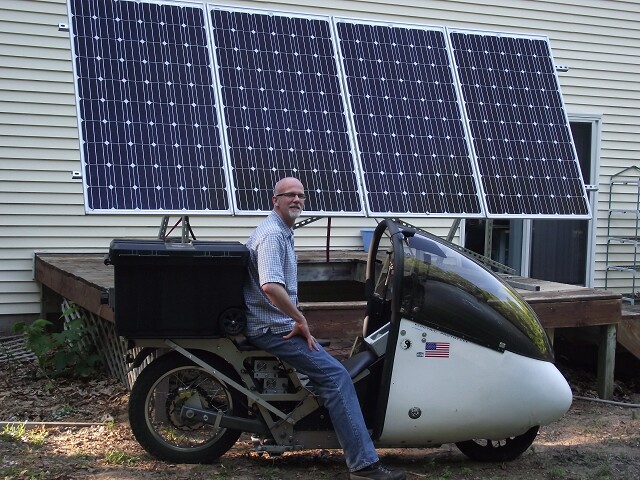 | ||||||||||||||||||||
|
How Can You Help?:
Schultz Engineering exists to fund the research and development of products that will make our world a better place. We fund our work by contracting our time as engineers and by investing our own money to build prototypes. We'd like to do more, but we work only with current revenue and must manage on a very tight budget. We welcome any support you'd like to share with us; Ideas, time or money. Contact Us | ||||||||||||||||||||
August 1, 2015 update: The best in the USA is Terry Hershner, he has consistently improved over the last few years. click here to see Terry's progress in detail. 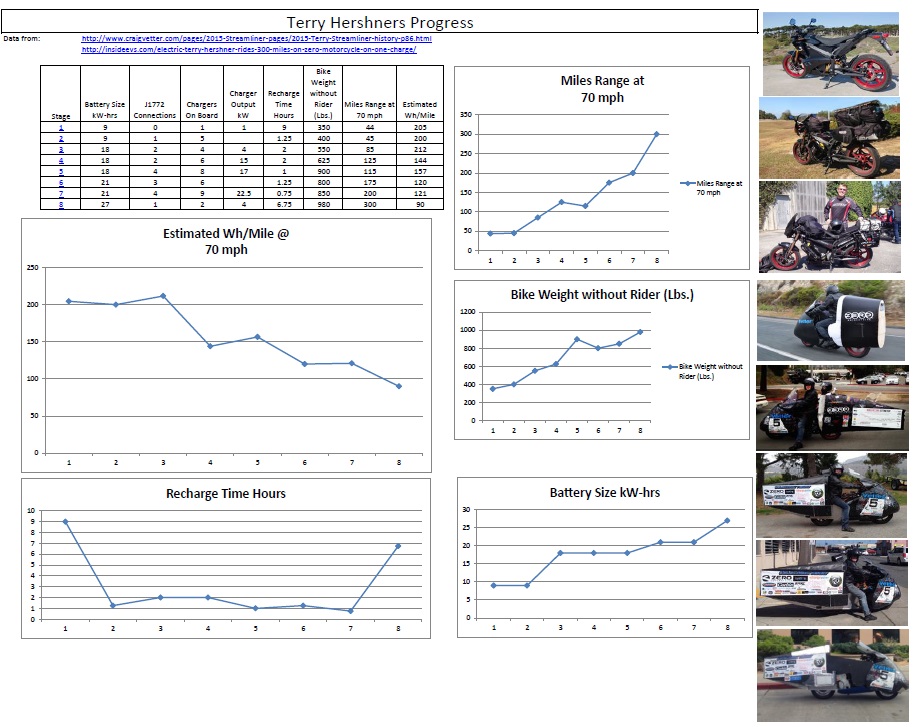 While looking a bit ratty after traveling 60,000+ miles. It just keeps getting better as Terry modify's it. 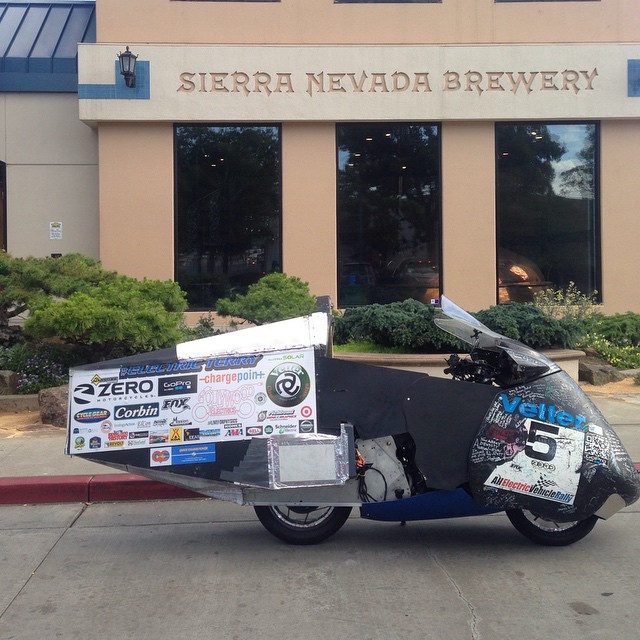 Learn more about Terry's bike at http://www.craigvetter.com/pages/2015-Streamliner-pages/2015-Terry-goes-300miles-on-one-charge-p89.html |